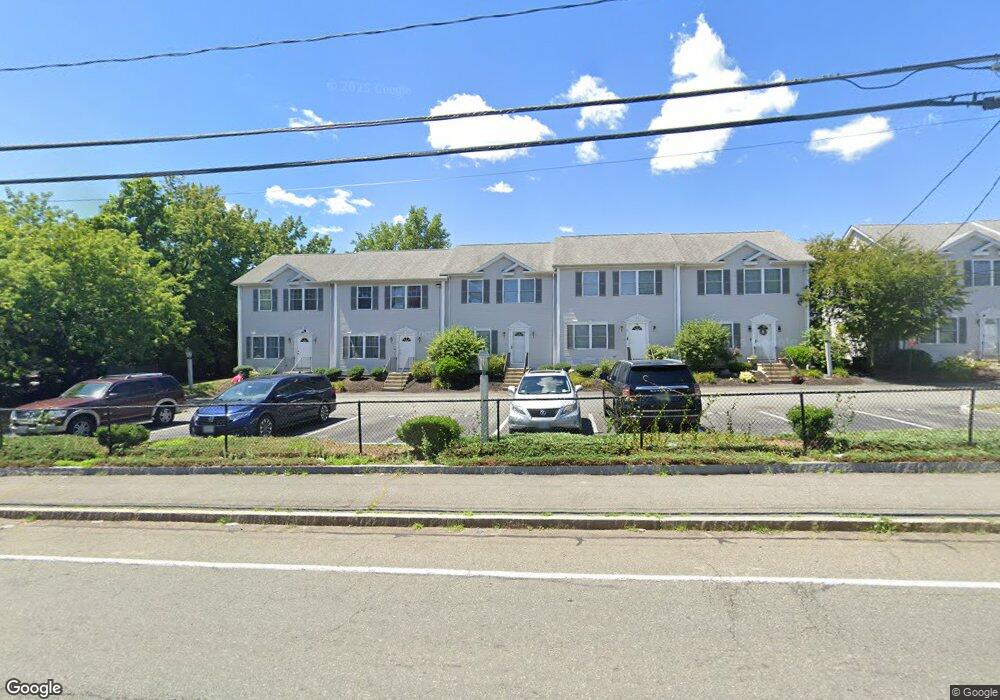
770 N Montello St Unit 1 Brockton, MA 02301
Montello NeighborhoodEstimated Value: $307,475 - $331,000
3
Beds
2
Baths
1,028
Sq Ft
$307/Sq Ft
Est. Value
About This Home
This home is located at 770 N Montello St Unit 1, Brockton, MA 02301 and is currently estimated at $315,869, approximately $307 per square foot. 770 N Montello St Unit 1 is a home located in Plymouth County with nearby schools including Raymond K-8 Elementary School, Louis F Angelo Elementary School, and Manthala George Jr. School.
Ownership History
Date
Name
Owned For
Owner Type
Purchase Details
Closed on
Aug 10, 2011
Sold by
Seney Bendel and Us Bank Na
Bought by
Us Bank Na
Current Estimated Value
Purchase Details
Closed on
Jul 3, 2006
Sold by
Emerson Place Llc
Bought by
Seney Bendel
Home Financials for this Owner
Home Financials are based on the most recent Mortgage that was taken out on this home.
Original Mortgage
$224,580
Interest Rate
6.58%
Mortgage Type
Purchase Money Mortgage
Create a Home Valuation Report for This Property
The Home Valuation Report is an in-depth analysis detailing your home's value as well as a comparison with similar homes in the area
Home Values in the Area
Average Home Value in this Area
Purchase History
| Date | Buyer | Sale Price | Title Company |
|---|---|---|---|
| Us Bank Na | $80,410 | -- | |
| Seney Bendel | $236,400 | -- |
Source: Public Records
Mortgage History
| Date | Status | Borrower | Loan Amount |
|---|---|---|---|
| Previous Owner | Seney Bendel | $224,580 |
Source: Public Records
Tax History Compared to Growth
Tax History
| Year | Tax Paid | Tax Assessment Tax Assessment Total Assessment is a certain percentage of the fair market value that is determined by local assessors to be the total taxable value of land and additions on the property. | Land | Improvement |
|---|---|---|---|---|
| 2025 | $3,190 | $263,400 | $0 | $263,400 |
| 2024 | $2,802 | $233,100 | $0 | $233,100 |
| 2023 | $2,898 | $223,300 | $0 | $223,300 |
| 2022 | $3,199 | $229,000 | $0 | $229,000 |
| 2021 | $3,039 | $209,600 | $0 | $209,600 |
| 2020 | $2,904 | $191,700 | $0 | $191,700 |
| 2019 | $2,687 | $172,900 | $0 | $172,900 |
| 2018 | $1,935 | $120,500 | $0 | $120,500 |
| 2017 | $1,856 | $115,300 | $0 | $115,300 |
| 2016 | $1,996 | $114,970 | $0 | $114,970 |
| 2015 | $1,889 | $104,070 | $0 | $104,070 |
| 2014 | $1,783 | $98,350 | $0 | $98,350 |
Source: Public Records
Map
Nearby Homes
- 20 Johnson Ct
- 737 N Montello St
- 731 N Montello St Unit 6
- 30 Intervale St
- 24 Oak St
- 112 Ames St
- 115 Ames St
- 0 Vine St
- 39 Upland Rd
- 863 N Main St
- 77 Porter St
- 144 Ames St
- 41 Martland Ave
- 25 Merritt Ave
- 95 Battles St
- 200 Sawtell Ave
- 932 N Main St Unit 5
- 560 N Montello St
- 29 Saint Casimir Ave
- 69 Beacon Park
- 45 Enterprise St Unit 22
- 45 Enterprise St Unit 21
- 45 Enterprise St Unit 20
- 45 Enterprise St Unit 19
- 45 Enterprise St Unit 18
- 45 Enterprise St Unit 17
- 45 Enterprise St Unit 16
- 45 Enterprise St Unit 15
- 45 Enterprise St Unit 14
- 45 Enterprise St Unit 13
- 45 Enterprise St Unit 12
- 770 N Montello St Unit 11
- 770 N Montello St Unit 10
- 770 N Montello St Unit 9
- 770 N Montello St Unit 8
- 770 N Montello St Unit 6
- 770 N Montello St Unit 5
- 770 N Montello St Unit 4
- 770 N Montello St Unit 3
- 770 N Montello St Unit 2