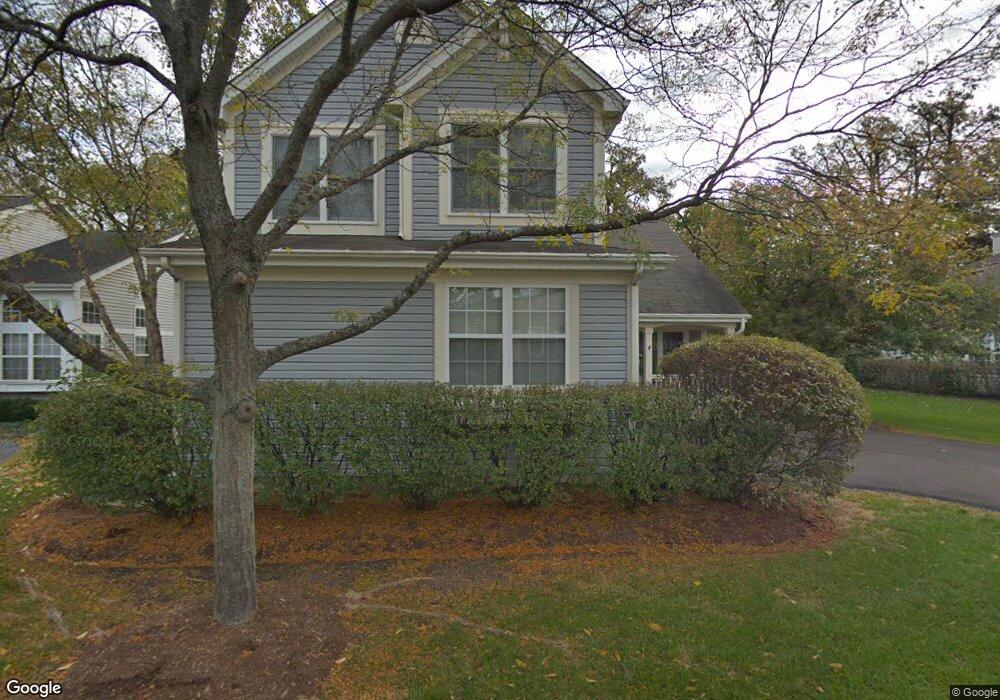
770 Norwich Ct Unit 1 Crystal Lake, IL 60012
Estimated Value: $445,298 - $512,000
4
Beds
3
Baths
2,400
Sq Ft
$194/Sq Ft
Est. Value
About This Home
This home is located at 770 Norwich Ct Unit 1, Crystal Lake, IL 60012 and is currently estimated at $465,075, approximately $193 per square foot. 770 Norwich Ct Unit 1 is a home located in McHenry County with nearby schools including Husmann Elementary School, Hannah Beardsley Middle School, and Prairie Ridge High School.
Ownership History
Date
Name
Owned For
Owner Type
Purchase Details
Closed on
Feb 7, 2011
Sold by
Black Katherine S
Bought by
Black Katherine S and Katherine S Black Trust
Current Estimated Value
Purchase Details
Closed on
Nov 11, 2010
Sold by
Flanagan Jean L
Bought by
Black Katherine S
Home Financials for this Owner
Home Financials are based on the most recent Mortgage that was taken out on this home.
Original Mortgage
$100,000
Outstanding Balance
$65,979
Interest Rate
4.27%
Mortgage Type
New Conventional
Estimated Equity
$399,096
Purchase Details
Closed on
Nov 13, 2006
Sold by
Flanagan Jean L
Bought by
Flanagan Jean L and The Jean L Flanagan Revocable Declaratio
Purchase Details
Closed on
Jun 10, 1996
Sold by
American National Bk & Tr Co Of Chicago
Bought by
Flanagan Jean L
Home Financials for this Owner
Home Financials are based on the most recent Mortgage that was taken out on this home.
Original Mortgage
$120,000
Interest Rate
8.31%
Create a Home Valuation Report for This Property
The Home Valuation Report is an in-depth analysis detailing your home's value as well as a comparison with similar homes in the area
Home Values in the Area
Average Home Value in this Area
Purchase History
| Date | Buyer | Sale Price | Title Company |
|---|---|---|---|
| Black Katherine S | -- | None Available | |
| Black Katherine S | $238,000 | Chicago Title | |
| Flanagan Jean L | -- | None Available | |
| Flanagan Jean L | $208,500 | -- |
Source: Public Records
Mortgage History
| Date | Status | Borrower | Loan Amount |
|---|---|---|---|
| Open | Black Katherine S | $100,000 | |
| Previous Owner | Flanagan Jean L | $120,000 |
Source: Public Records
Tax History Compared to Growth
Tax History
| Year | Tax Paid | Tax Assessment Tax Assessment Total Assessment is a certain percentage of the fair market value that is determined by local assessors to be the total taxable value of land and additions on the property. | Land | Improvement |
|---|---|---|---|---|
| 2024 | $9,130 | $122,568 | $23,404 | $99,164 |
| 2023 | $8,759 | $109,916 | $20,988 | $88,928 |
| 2022 | $9,014 | $104,866 | $20,990 | $83,876 |
| 2021 | $8,558 | $98,318 | $19,679 | $78,639 |
| 2020 | $8,381 | $95,371 | $19,089 | $76,282 |
| 2019 | $7,872 | $90,674 | $18,149 | $72,525 |
| 2018 | $8,256 | $92,775 | $17,048 | $75,727 |
| 2017 | $8,877 | $88,882 | $16,333 | $72,549 |
| 2016 | $8,803 | $84,803 | $15,583 | $69,220 |
| 2013 | -- | $77,421 | $14,830 | $62,591 |
Source: Public Records
Map
Nearby Homes
- 462 Kelly Ln
- 221 Mistwood Ln
- 845 E Terra Cotta Ave
- 0 Millennium Dr
- 532 Nunda Trail
- 797 Silk Oak Ln Unit 797
- 5804 Terra Cotta Rd
- Lot 24 Knaack Blvd
- Lots 22,23,24,31,32 Knaack Blvd
- 4915 Terra Cotta Rd
- 5419 Rita Ave
- 546 Cimmaron Cir
- 654 Cassia Ct
- 648 Cassia Ct
- 660 Cassia Ct
- 632 Cassia Ct
- 634 Cassia Ct
- Charlotte Plan at Woodlore Estates - Woodlore Townes - Phase 2
- Marianne Plan at Woodlore Estates - Woodlore Townes - Phase 2
- Darcy Plan at Woodlore Estates - Woodlore Townes - Phase 2
- 767 Norwich Ct
- 766 Norwich Ct
- 765 Norwich Ct
- 758 Norwich Ct
- 763 Norwich Ct Unit 1
- 757 Norwich Ct Unit 1
- 750 Norwich Ct
- 753 Norwich Ct
- 734 Norwich Ct
- 745 Norwich Ct
- 742 Norwich Ct
- 732 Nashua Ct
- 728 Nashua Ct
- 452 Kelly Ln
- 722 Nashua Ct
- 733 Norwich Ct
- 736 Nashua Ct
- 454 Kelly Ln
- 733 Wyndmuir Dr
- 450 Kelly Ln