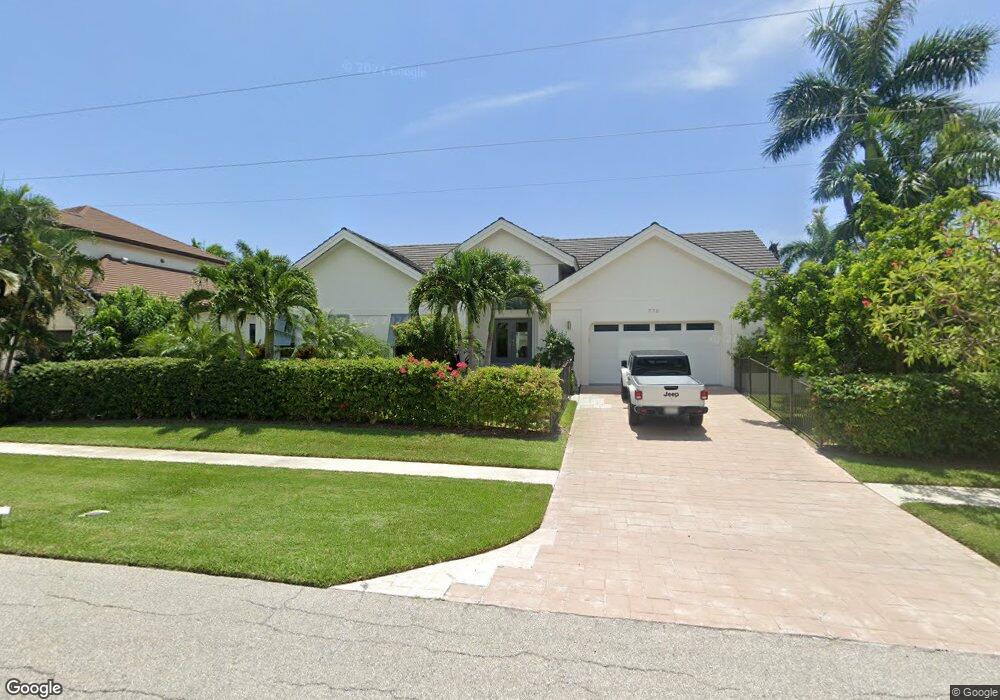
770 Partridge Ct Unit 19 Marco Island, FL 34145
Estimated Value: $2,287,000 - $2,428,000
--
Bed
5
Baths
2,807
Sq Ft
$842/Sq Ft
Est. Value
About This Home
This home is located at 770 Partridge Ct Unit 19, Marco Island, FL 34145 and is currently estimated at $2,362,689, approximately $841 per square foot. 770 Partridge Ct Unit 19 is a home located in Collier County with nearby schools including Tommie Barfield Elementary School, Manatee Middle School, and Lely High School.
Ownership History
Date
Name
Owned For
Owner Type
Purchase Details
Closed on
Apr 21, 2025
Sold by
Harvey Janet Ann and Janet A Harvey Revocable Living Trust
Bought by
Marco Salt Life Living Llc
Current Estimated Value
Purchase Details
Closed on
Sep 1, 2017
Sold by
Seaside Investment Properties Inc
Bought by
Harvey Janet Ann
Purchase Details
Closed on
Jul 14, 2014
Sold by
Partridge Partners Llc
Bought by
Seaside Investment Properties Inc
Purchase Details
Closed on
May 14, 2008
Sold by
Lepere Ronald R and Lepere Peggy R
Bought by
Partridge Partners Llc
Home Financials for this Owner
Home Financials are based on the most recent Mortgage that was taken out on this home.
Original Mortgage
$600,000
Interest Rate
5.86%
Mortgage Type
Purchase Money Mortgage
Purchase Details
Closed on
Aug 13, 1996
Sold by
Lepere Ronald R and Lepere Peggy R
Bought by
Lepere Ronald R and Lepere Peggy R
Create a Home Valuation Report for This Property
The Home Valuation Report is an in-depth analysis detailing your home's value as well as a comparison with similar homes in the area
Home Values in the Area
Average Home Value in this Area
Purchase History
| Date | Buyer | Sale Price | Title Company |
|---|---|---|---|
| Marco Salt Life Living Llc | $2,385,000 | None Listed On Document | |
| Marco Salt Life Living Llc | $2,385,000 | None Listed On Document | |
| Harvey Janet Ann | $1,335,000 | Attorney | |
| Seaside Investment Properties Inc | $883,000 | Attorney | |
| Partridge Partners Llc | $900,000 | First Title & Abstract | |
| Lepere Ronald R | -- | -- |
Source: Public Records
Mortgage History
| Date | Status | Borrower | Loan Amount |
|---|---|---|---|
| Previous Owner | Partridge Partners Llc | $600,000 |
Source: Public Records
Tax History Compared to Growth
Tax History
| Year | Tax Paid | Tax Assessment Tax Assessment Total Assessment is a certain percentage of the fair market value that is determined by local assessors to be the total taxable value of land and additions on the property. | Land | Improvement |
|---|---|---|---|---|
| 2025 | $18,641 | $2,184,185 | $1,212,201 | $971,984 |
| 2024 | $21,602 | $2,014,768 | $1,191,263 | $823,505 |
| 2023 | $21,602 | $2,272,162 | $1,212,201 | $1,059,961 |
| 2022 | $20,700 | $2,057,633 | $1,133,959 | $923,674 |
| 2021 | $14,046 | $1,277,257 | $517,940 | $759,317 |
| 2020 | $13,499 | $1,207,822 | $0 | $0 |
| 2019 | $12,131 | $1,086,456 | $499,400 | $587,056 |
| 2018 | $12,131 | $1,084,138 | $501,600 | $582,538 |
| 2017 | $9,447 | $829,893 | $528,000 | $301,893 |
| 2016 | $9,112 | $790,856 | $0 | $0 |
| 2015 | $10,766 | $912,018 | $0 | $0 |
| 2014 | $8,361 | $694,808 | $0 | $0 |
Source: Public Records
Map
Nearby Homes
- 780 Partridge Ct
- 760 Partridge Ct
- 1181 Mimosa Ct
- 750 Partridge Ct
- 790 Partridge Ct
- 1190 Mimosa Ct
- 896 Banyan Ct
- 1191 Mimosa Ct
- 791 Partridge Ct Unit 43
- 740 Partridge Ct
- 892 Banyan Ct
- 1180 Ember Ct
- 0 Partridge Ct
- 0 Ember Ct
- 1201 Mimosa Ct
- 801 Partridge Ct
- 1200 Mimosa Ct
- 730 Partridge Ct
- 800 Partridge Ct