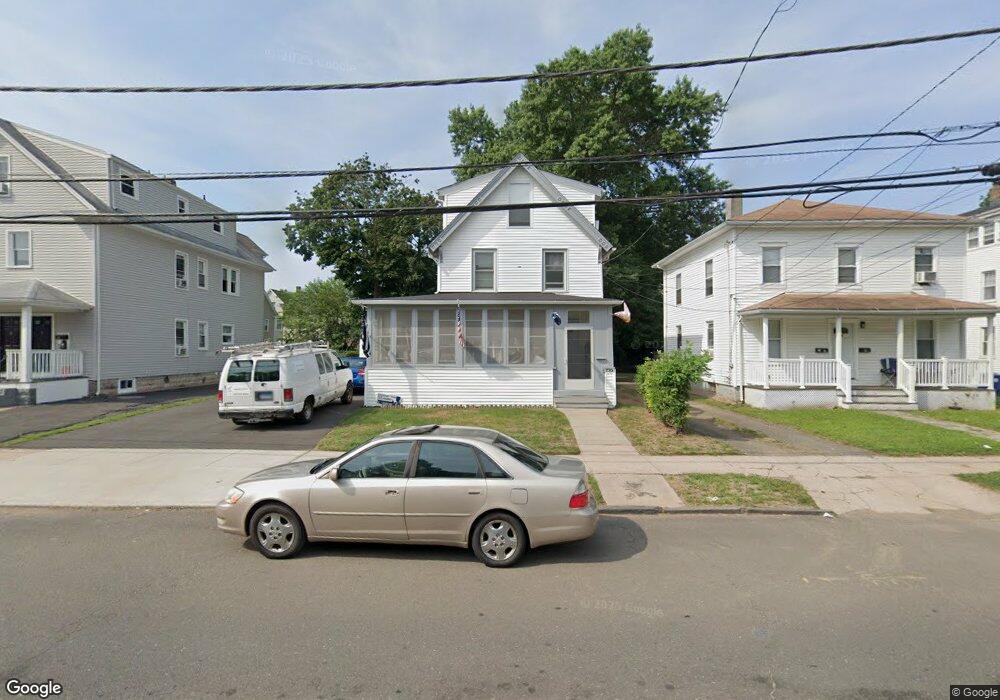
770 Savin Ave West Haven, CT 06516
West Haven Center NeighborhoodEstimated Value: $305,000 - $377,177
3
Beds
1
Bath
1,776
Sq Ft
$197/Sq Ft
Est. Value
About This Home
This home is located at 770 Savin Ave, West Haven, CT 06516 and is currently estimated at $349,044, approximately $196 per square foot. 770 Savin Ave is a home located in New Haven County with nearby schools including Carrigan 5/6 Intermediate School, Harry M. Bailey Middle School, and West Haven High School.
Ownership History
Date
Name
Owned For
Owner Type
Purchase Details
Closed on
Jul 7, 2010
Sold by
Tompkins Cheryl
Bought by
Tompkins Todd
Current Estimated Value
Purchase Details
Closed on
Nov 25, 2002
Sold by
Department Of Housing & Urban Dev
Bought by
Redmann Cheryl
Purchase Details
Closed on
Jun 29, 2000
Sold by
Ipbach Susan L
Bought by
Velez Jose A and Velez Carmen
Purchase Details
Closed on
May 23, 1995
Sold by
Lukaszewski Catherine
Bought by
Ipbach Susan L
Create a Home Valuation Report for This Property
The Home Valuation Report is an in-depth analysis detailing your home's value as well as a comparison with similar homes in the area
Home Values in the Area
Average Home Value in this Area
Purchase History
| Date | Buyer | Sale Price | Title Company |
|---|---|---|---|
| Tompkins Todd | -- | -- | |
| Redmann Cheryl | $112,000 | -- | |
| Velez Jose A | $99,000 | -- | |
| Ipbach Susan L | $70,000 | -- | |
| Tompkins Todd | -- | -- | |
| Redmann Cheryl | $112,000 | -- | |
| Velez Jose A | $99,000 | -- | |
| Ipbach Susan L | $70,000 | -- |
Source: Public Records
Mortgage History
| Date | Status | Borrower | Loan Amount |
|---|---|---|---|
| Open | Ipbach Susan L | $220,522 | |
| Previous Owner | Ipbach Susan L | $234,891 |
Source: Public Records
Tax History Compared to Growth
Tax History
| Year | Tax Paid | Tax Assessment Tax Assessment Total Assessment is a certain percentage of the fair market value that is determined by local assessors to be the total taxable value of land and additions on the property. | Land | Improvement |
|---|---|---|---|---|
| 2025 | $8,010 | $231,980 | $64,820 | $167,160 |
| 2024 | $7,265 | $149,730 | $44,940 | $104,790 |
| 2023 | $6,964 | $149,730 | $44,940 | $104,790 |
| 2022 | $6,828 | $149,730 | $44,940 | $104,790 |
| 2021 | $6,828 | $149,730 | $44,940 | $104,790 |
| 2020 | $6,511 | $129,010 | $36,470 | $92,540 |
| 2019 | $6,279 | $129,010 | $36,470 | $92,540 |
| 2018 | $6,225 | $129,010 | $36,470 | $92,540 |
| 2017 | $5,891 | $129,010 | $36,470 | $92,540 |
| 2016 | $5,878 | $129,010 | $36,470 | $92,540 |
| 2015 | $5,714 | $141,610 | $39,200 | $102,410 |
| 2014 | $5,679 | $141,610 | $39,200 | $102,410 |
Source: Public Records
Map
Nearby Homes