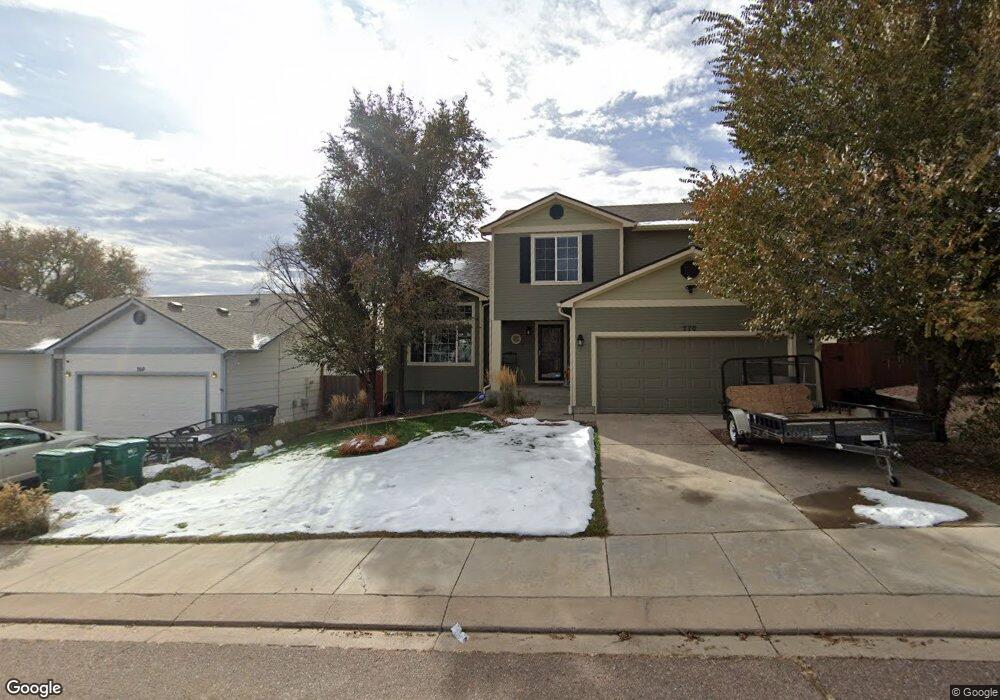
770 Winebrook Way Fountain, CO 80817
North Fountain Valley NeighborhoodEstimated Value: $438,279 - $485,000
4
Beds
2
Baths
2,280
Sq Ft
$205/Sq Ft
Est. Value
About This Home
This home is located at 770 Winebrook Way, Fountain, CO 80817 and is currently estimated at $466,320, approximately $204 per square foot. 770 Winebrook Way is a home located in El Paso County with nearby schools including Eagleside Elementary School, Fountain Middle School, and Fountain-Fort Carson High School.
Ownership History
Date
Name
Owned For
Owner Type
Purchase Details
Closed on
Jul 23, 2021
Sold by
Nolan Kevin Roy and Nolan Sanae
Bought by
Geving Christopher L and Geving Whitney Lynne
Current Estimated Value
Home Financials for this Owner
Home Financials are based on the most recent Mortgage that was taken out on this home.
Original Mortgage
$450,120
Outstanding Balance
$408,788
Interest Rate
2.96%
Mortgage Type
VA
Estimated Equity
$57,532
Purchase Details
Closed on
Dec 30, 2016
Sold by
Vanvanauken Leon Van
Bought by
Nolan Kevin Roy and Nolan Sanae
Home Financials for this Owner
Home Financials are based on the most recent Mortgage that was taken out on this home.
Original Mortgage
$239,900
Interest Rate
3.94%
Mortgage Type
VA
Purchase Details
Closed on
Sep 20, 2007
Sold by
Heritage Homes Inc
Bought by
Vanauken Robert Leon
Home Financials for this Owner
Home Financials are based on the most recent Mortgage that was taken out on this home.
Original Mortgage
$232,567
Interest Rate
6.63%
Mortgage Type
VA
Create a Home Valuation Report for This Property
The Home Valuation Report is an in-depth analysis detailing your home's value as well as a comparison with similar homes in the area
Home Values in the Area
Average Home Value in this Area
Purchase History
| Date | Buyer | Sale Price | Title Company |
|---|---|---|---|
| Geving Christopher L | $440,000 | Land Title Guarantee Company | |
| Nolan Kevin Roy | $239,800 | Empire Title Colorado Spring | |
| Vanauken Robert Leon | $232,900 | Fahtco |
Source: Public Records
Mortgage History
| Date | Status | Borrower | Loan Amount |
|---|---|---|---|
| Open | Geving Christopher L | $450,120 | |
| Previous Owner | Nolan Kevin Roy | $239,900 | |
| Previous Owner | Vanauken Robert Leon | $232,567 |
Source: Public Records
Tax History Compared to Growth
Tax History
| Year | Tax Paid | Tax Assessment Tax Assessment Total Assessment is a certain percentage of the fair market value that is determined by local assessors to be the total taxable value of land and additions on the property. | Land | Improvement |
|---|---|---|---|---|
| 2025 | $1,837 | $31,730 | -- | -- |
| 2024 | $1,726 | $32,610 | $4,340 | $28,270 |
| 2022 | $1,458 | $23,040 | $3,430 | $19,610 |
| 2021 | $1,366 | $23,710 | $3,530 | $20,180 |
| 2020 | $1,207 | $20,550 | $3,090 | $17,460 |
| 2019 | $1,186 | $20,550 | $3,090 | $17,460 |
| 2018 | $1,105 | $18,540 | $3,110 | $15,430 |
| 2017 | $1,093 | $18,540 | $3,110 | $15,430 |
| 2016 | $1,034 | $17,520 | $3,220 | $14,300 |
| 2015 | $1,035 | $17,520 | $3,220 | $14,300 |
| 2014 | $921 | $15,670 | $3,220 | $12,450 |
Source: Public Records
Map
Nearby Homes
- 830 Winebrook Way
- 9223 Waters Edge Dr
- 7455 Willowdale Dr
- 960 Lords Hill Dr
- 803 Ridgebury Place
- 1223 Cailin Way
- 7431 Willow Pines Place
- 7452 Wind Haven Trail
- 1153 Cailin Way
- 7901 Whistlestop Ln
- 7890 Treehouse Terrace
- 7166 Araia Dr
- 7420 Wind Haven Trail
- 7327 Willow Pines Place
- 739 Memory Ln
- 2031 Hibbard Ln
- 9160 Link Rd
- 7370 Tributary Ct
- 2124 Bent Tree Ln
- 654 High Tea Ct
- 780 Winebrook Way
- 760 Winebrook Way
- 750 Winebrook Way
- 790 Winebrook Way
- 775 Winebrook Way
- 765 Winebrook Way
- 740 Winebrook Way
- 795 Winebrook Way
- 810 Winebrook Way
- 755 Winebrook Way
- 815 Winebrook Way
- 745 Winebrook Way
- 820 Winebrook Way
- 8990 Celebrity Ct
- 835 Winebrook Way
- 8970 Celebrity Ct
- 8989 Celebrity Ct
- 735 Winebrook Way
- 845 Winebrook Way
- 840 Winebrook Way