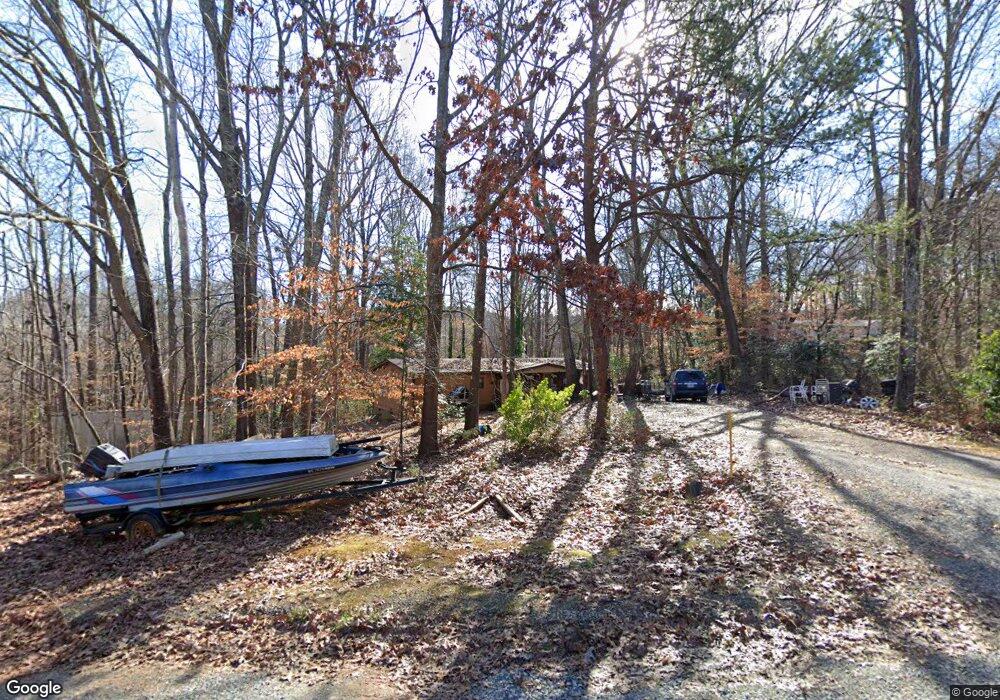
7700 Lowesville Meadows Rd Stanley, NC 28164
Estimated Value: $121,702 - $267,000
3
Beds
2
Baths
1,248
Sq Ft
$156/Sq Ft
Est. Value
About This Home
This home is located at 7700 Lowesville Meadows Rd, Stanley, NC 28164 and is currently estimated at $194,176, approximately $155 per square foot. 7700 Lowesville Meadows Rd is a home located in Lincoln County with nearby schools including Catawba Springs Elementary School, East Lincoln Middle School, and East Lincoln High School.
Ownership History
Date
Name
Owned For
Owner Type
Purchase Details
Closed on
Oct 1, 2019
Sold by
Equity Trust Company
Bought by
Dixon Brian C
Current Estimated Value
Home Financials for this Owner
Home Financials are based on the most recent Mortgage that was taken out on this home.
Original Mortgage
$67,500
Outstanding Balance
$45,001
Interest Rate
3.5%
Mortgage Type
New Conventional
Estimated Equity
$149,175
Purchase Details
Closed on
Mar 18, 2014
Sold by
Fannie Mae
Bought by
Equity Trust Co
Purchase Details
Closed on
Sep 23, 2013
Sold by
Wright Michael S and Wright Lydia H
Bought by
Federal National Mortgage Association and Fannie Mae
Purchase Details
Closed on
Jul 1, 1996
Bought by
Wright Michael S and Lydia Faye Huds
Purchase Details
Closed on
Nov 19, 1992
Bought by
Scott Andrew Charles
Create a Home Valuation Report for This Property
The Home Valuation Report is an in-depth analysis detailing your home's value as well as a comparison with similar homes in the area
Purchase History
| Date | Buyer | Sale Price | Title Company |
|---|---|---|---|
| Dixon Brian C | $75,000 | None Available | |
| Equity Trust Co | -- | None Available | |
| Federal National Mortgage Association | $62,249 | None Available | |
| Wright Michael S | $63,500 | -- | |
| Scott Andrew Charles | $64,500 | -- |
Source: Public Records
Mortgage History
| Date | Status | Borrower | Loan Amount |
|---|---|---|---|
| Open | Dixon Brian C | $67,500 |
Source: Public Records
Tax History
| Year | Tax Paid | Tax Assessment Tax Assessment Total Assessment is a certain percentage of the fair market value that is determined by local assessors to be the total taxable value of land and additions on the property. | Land | Improvement |
|---|---|---|---|---|
| 2025 | $895 | $125,040 | $56,683 | $68,357 |
| 2024 | $872 | $125,040 | $56,683 | $68,357 |
| 2023 | $867 | $125,040 | $56,683 | $68,357 |
| 2022 | $716 | $81,358 | $45,946 | $35,412 |
| 2021 | $720 | $81,358 | $45,946 | $35,412 |
| 2020 | $567 | $81,358 | $45,946 | $35,412 |
| 2019 | $567 | $81,358 | $45,946 | $35,412 |
| 2018 | $651 | $78,593 | $38,919 | $39,674 |
| 2017 | $550 | $78,593 | $38,919 | $39,674 |
| 2016 | $548 | $78,593 | $38,919 | $39,674 |
| 2015 | $622 | $78,593 | $38,919 | $39,674 |
| 2014 | $713 | $94,701 | $43,306 | $51,395 |
Source: Public Records
Map
Nearby Homes
- 8013 Caswell Rd
- 7663 Woodcrest Dr
- 7508 Turkey Trot Dr
- 535 Cowans Villa Rd Unit 6
- 7221 Monaghan Ct
- 963 Brookdale Ln
- 7466 Mountain Ridge Dr
- 7967 Glen Abbey Cir
- 7039 Sedgebrook Dr W
- 7275 Woodcock Trail
- 7125 Sedgebrook Dr W
- 7522 Turnberry Ln
- 7157 Sedgebrook Dr W
- Lot #43 Lytham Ln
- 214 Lytham Ln
- 7709 Sedgebrook Dr E
- 7083 Ridgeway Rd
- 7695 Sedgebrook Dr E
- 7738 Burning Ridge Dr
- 329 Bent Tree Dr
- 7686 Lowesville Meadows Rd
- 7695 Lowesville Meadows Rd
- 7672 Lowesville Meadows Rd
- 7677 Lowesville Meadows Rd
- 7664 Lowesville Meadows Rd
- 7665 Lowesville Meadows Rd
- 7648 Lowesville Meadows Rd
- 7649 Lowesville Meadows Rd
- 7802 Caswell Rd
- 7632 Lowesville Meadows Rd
- 7770 Caswell Rd
- 7691 Ivey Meadow Ln
- 7826 Caswell Rd
- Lot 16 Lowesville Meadows Rd
- 7618 Lowesville Meadows Rd
- 7850 Caswell Rd
- 7625 Lowesville Meadows Rd
- 7769 Caswell Rd
- 7615 Lowesville Meadows Rd
- 0 Caswell Rd
Your Personal Tour Guide
Ask me questions while you tour the home.