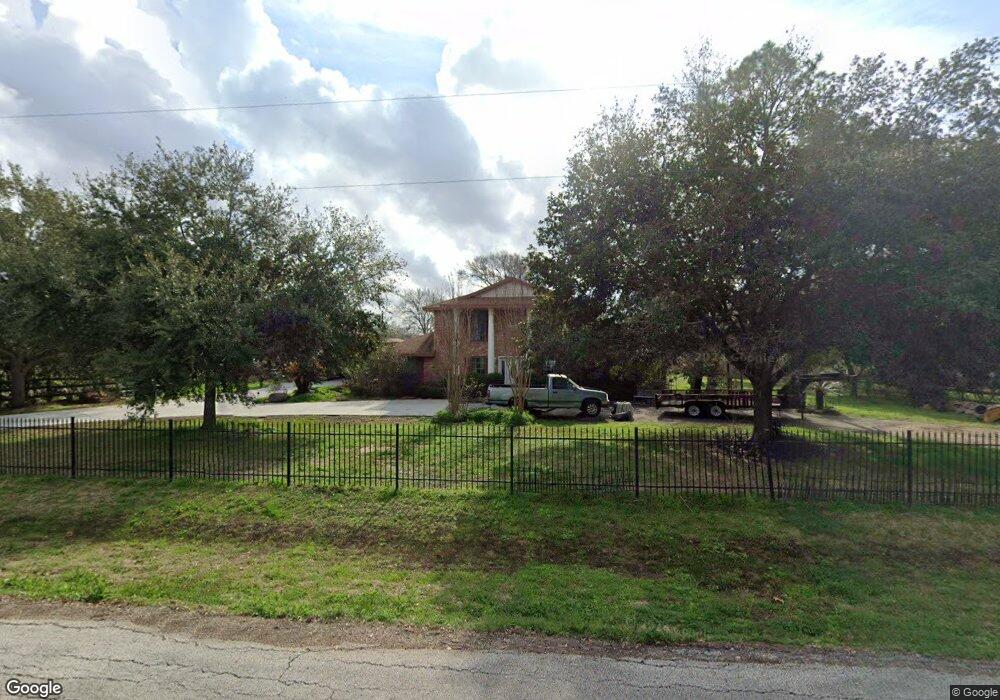
7701 Ansel Ln Richmond, TX 77469
Estimated Value: $344,000 - $509,000
4
Beds
3
Baths
2,947
Sq Ft
$144/Sq Ft
Est. Value
About This Home
This home is located at 7701 Ansel Ln, Richmond, TX 77469 and is currently estimated at $423,851, approximately $143 per square foot. 7701 Ansel Ln is a home located in Fort Bend County.
Ownership History
Date
Name
Owned For
Owner Type
Purchase Details
Closed on
Oct 12, 2020
Sold by
Balderas Lorenzo and Rivas Rosa
Bought by
Balderas Leopoldo and Balderas Maria
Current Estimated Value
Purchase Details
Closed on
Aug 24, 2011
Sold by
Santana Aniceta
Bought by
Balderas Lorenzo and Rivas Rosa
Home Financials for this Owner
Home Financials are based on the most recent Mortgage that was taken out on this home.
Original Mortgage
$98,400
Outstanding Balance
$68,004
Interest Rate
4.53%
Mortgage Type
New Conventional
Estimated Equity
$355,847
Purchase Details
Closed on
May 25, 2006
Sold by
Hill Glen H and Hill Jane Kocurek
Bought by
Santana Aniceta
Home Financials for this Owner
Home Financials are based on the most recent Mortgage that was taken out on this home.
Original Mortgage
$120,750
Interest Rate
6.5%
Mortgage Type
Fannie Mae Freddie Mac
Create a Home Valuation Report for This Property
The Home Valuation Report is an in-depth analysis detailing your home's value as well as a comparison with similar homes in the area
Home Values in the Area
Average Home Value in this Area
Purchase History
| Date | Buyer | Sale Price | Title Company |
|---|---|---|---|
| Balderas Leopoldo | -- | None Available | |
| Balderas Lorenzo | -- | None Available | |
| Santana Aniceta | -- | Startex Title | |
| Balderas Lorenzo Etal | -- | -- |
Source: Public Records
Mortgage History
| Date | Status | Borrower | Loan Amount |
|---|---|---|---|
| Open | Balderas Lorenzo | $98,400 | |
| Previous Owner | Balderas Lorenzo Etal | $120,750 |
Source: Public Records
Tax History Compared to Growth
Tax History
| Year | Tax Paid | Tax Assessment Tax Assessment Total Assessment is a certain percentage of the fair market value that is determined by local assessors to be the total taxable value of land and additions on the property. | Land | Improvement |
|---|---|---|---|---|
| 2025 | $5,882 | $390,972 | $87,400 | $303,572 |
| 2024 | $5,882 | $393,886 | $81,808 | $312,078 |
| 2023 | $5,297 | $358,078 | $0 | $446,037 |
| 2022 | $4,680 | $336,450 | $9,000 | $327,450 |
| 2021 | $5,387 | $300,170 | $9,000 | $291,170 |
| 2020 | $2,289 | $251,230 | $9,000 | $242,230 |
| 2019 | $4,901 | $250,810 | $9,000 | $241,810 |
| 2018 | $4,996 | $255,030 | $9,000 | $246,030 |
| 2017 | $3,978 | $202,550 | $9,000 | $193,550 |
| 2016 | $3,451 | $175,730 | $9,000 | $166,730 |
| 2015 | $3,494 | $176,820 | $9,000 | $167,820 |
| 2014 | $2,824 | $149,820 | $9,000 | $140,820 |
Source: Public Records
Map
Nearby Homes
- 6917 Kari Ln
- 7115 Kamas Ln
- 4310 Horseshoe Dr
- 0 Fm 361 Rd Unit 24089668
- 6429 Fm 2218 Rd
- 7403 Fm 361 Rd
- 4821 Walters Rd
- 0 Farm-To-market 2218
- 2927 Canoe Birch Ct
- 4927 Windy Poplar Trail
- 4914 Mountain Maple Trail
- 4922 Lacebark Pine Trail
- 4910 Mountain Maple Trail
- 5410 Sunset Trail
- 3010 Coachmaker Trail
- 5115 Santa Cruz Bay
- 5123 Santa Cruz Bay Bayou
- 3327 Learning Tree Ln
- 8334 Galler Rd
- 5103 Santa Cruz Bay