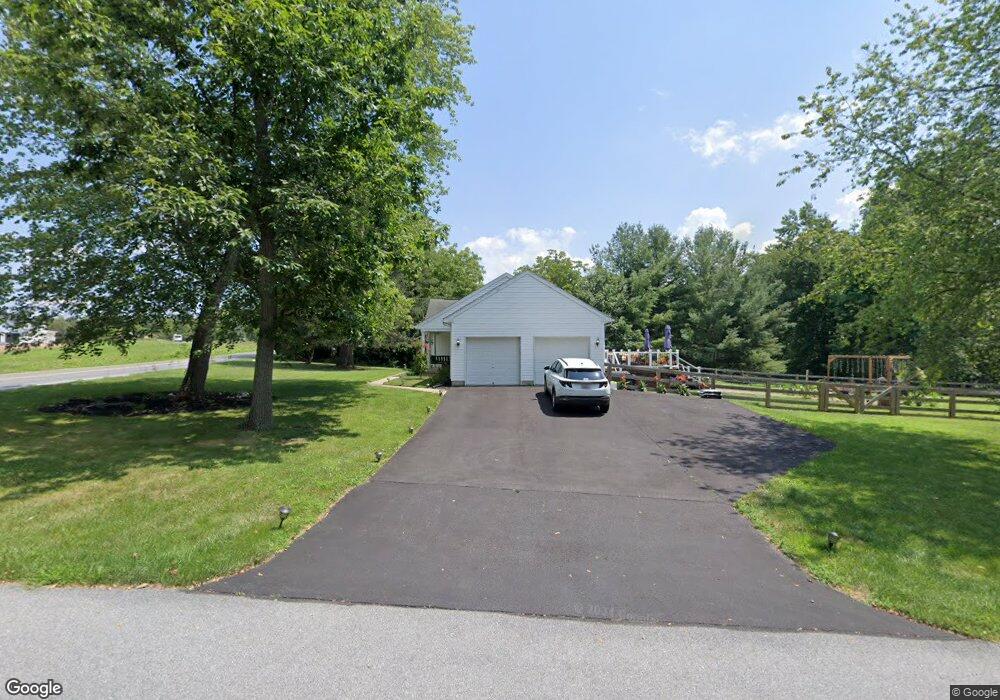
7701 Hobbs Ct Mount Airy, MD 21771
Estimated Value: $638,122 - $752,000
--
Bed
--
Bath
1,580
Sq Ft
$429/Sq Ft
Est. Value
About This Home
This home is located at 7701 Hobbs Ct, Mount Airy, MD 21771 and is currently estimated at $677,031, approximately $428 per square foot. 7701 Hobbs Ct is a home located in Frederick County with nearby schools including Twin Ridge Elementary School, Windsor Knolls Middle School, and Linganore High School.
Ownership History
Date
Name
Owned For
Owner Type
Purchase Details
Closed on
Jan 12, 2021
Sold by
Noell John R and Noell Judy M
Bought by
Webber Leonard E
Current Estimated Value
Home Financials for this Owner
Home Financials are based on the most recent Mortgage that was taken out on this home.
Original Mortgage
$480,810
Outstanding Balance
$428,822
Interest Rate
2.67%
Mortgage Type
VA
Estimated Equity
$248,209
Purchase Details
Closed on
May 28, 2002
Sold by
Christian Homes & Building Manag
Bought by
Noell John R and Noell Judy M
Purchase Details
Closed on
Sep 18, 2001
Sold by
Nations Credit Financial
Bought by
Christian Homes & Building Manag
Purchase Details
Closed on
Sep 13, 2000
Sold by
Warner Wayne
Bought by
Nations Credit Financial
Purchase Details
Closed on
Jan 5, 1998
Sold by
Everly Wilson A and Everly Betty J
Bought by
Warner Wayne
Create a Home Valuation Report for This Property
The Home Valuation Report is an in-depth analysis detailing your home's value as well as a comparison with similar homes in the area
Home Values in the Area
Average Home Value in this Area
Purchase History
| Date | Buyer | Sale Price | Title Company |
|---|---|---|---|
| Webber Leonard E | $470,000 | Sage Title Group Llc | |
| Noell John R | $247,880 | -- | |
| Christian Homes & Building Manag | $68,000 | -- | |
| Nations Credit Financial | $10,000 | -- | |
| Warner Wayne | -- | -- |
Source: Public Records
Mortgage History
| Date | Status | Borrower | Loan Amount |
|---|---|---|---|
| Open | Webber Leonard E | $480,810 | |
| Closed | Webber Leonard E | $480,810 | |
| Closed | Christian Homes & Building Manag | -- |
Source: Public Records
Tax History Compared to Growth
Tax History
| Year | Tax Paid | Tax Assessment Tax Assessment Total Assessment is a certain percentage of the fair market value that is determined by local assessors to be the total taxable value of land and additions on the property. | Land | Improvement |
|---|---|---|---|---|
| 2025 | $5,842 | $502,033 | -- | -- |
| 2024 | $5,842 | $470,200 | $149,300 | $320,900 |
| 2023 | $5,384 | $450,867 | $0 | $0 |
| 2022 | $5,160 | $431,533 | $0 | $0 |
| 2021 | $4,857 | $412,200 | $119,600 | $292,600 |
| 2020 | $4,778 | $398,667 | $0 | $0 |
| 2019 | $4,621 | $385,133 | $0 | $0 |
| 2018 | $4,355 | $371,600 | $119,600 | $252,000 |
| 2017 | $4,317 | $371,600 | $0 | $0 |
| 2016 | $3,847 | $358,933 | $0 | $0 |
| 2015 | $3,847 | $352,600 | $0 | $0 |
| 2014 | $3,847 | $341,733 | $0 | $0 |
Source: Public Records
Map
Nearby Homes
- 7407 Woodville Rd
- 7309 Talbot Run Rd
- 7208 Wilson Rd
- 4417 Buffalo Rd
- 6468-F General Dr Unit GREENRIDGE
- 6468-A General Dr Unit BURKE
- 6468-C General Dr Unit MILLBROOKE
- 6468-E General Dr Unit MANOR
- 6468-D General Dr Unit BARTHOLOW
- 6468-B General Dr Unit WALBERT
- 6460 General Dr Unit ASHCROFT
- 6468 Woodville Rd Unit WELLER
- 6452 General Dr Unit WALBERT
- 3816 A Jim Smith Ln
- 8730 Mapleville Rd
- 4004 Windermere Way
- 3870 Roop Rd
- 3720 Buffalo Rd
- 5345 Pommel Dr
- 0 New Windsor Rd Unit MDFR2073236
- 14227 Peddicord Rd
- 14315 Peddicord Rd
- LOT 1 Hobbs Ct
- 0 Hobb's Ct Unit FR8698203
- LOT 3 Hobbs Ct
- 7703 Hobbs Ct
- 7701 Harvest Hills Ct
- 7700 Hobbs Ct
- 7702 Hobbs Ct
- 14325 Peddicord Rd
- 7705 Hobbs Ct
- 7704 Hobbs Ct
- 7707 Hobbs Ct
- 7702 Harvest Hills Ct
- 0 Hobb's Ct Unit FR8729361
- 7703 Harvest Hills Ct
- 1 LOT Peddicord Rd
- 3 LOT Peddicord Rd
- 0 Peddicord Rd
- 7706 Hobbs Ct