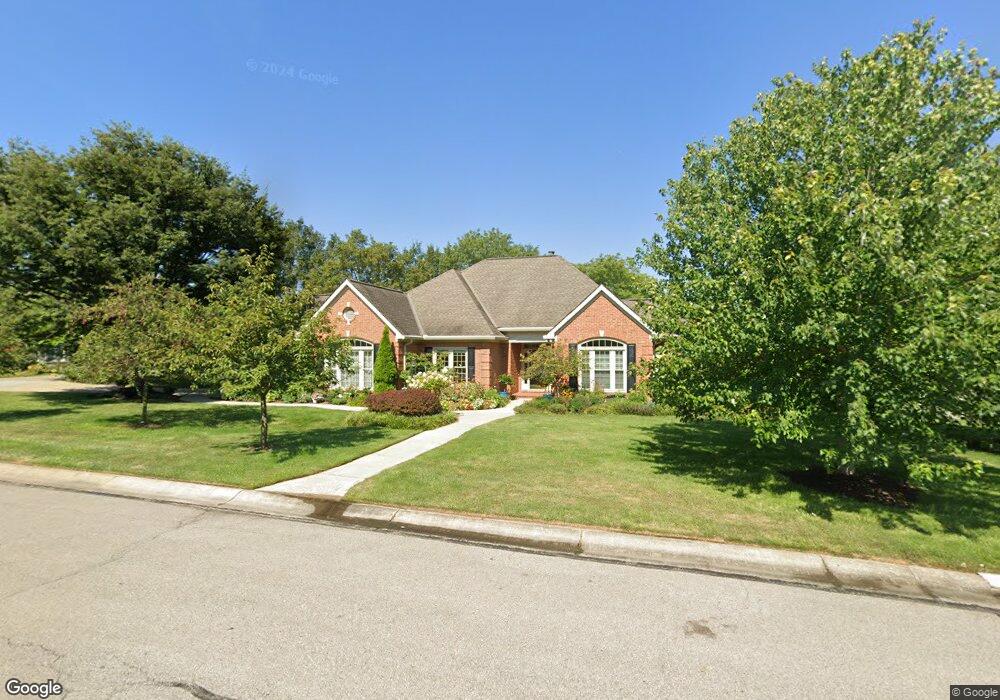
7705 Pine Isle Ct Cincinnati, OH 45244
Estimated Value: $615,000 - $753,000
4
Beds
3
Baths
2,436
Sq Ft
$274/Sq Ft
Est. Value
About This Home
This home is located at 7705 Pine Isle Ct, Cincinnati, OH 45244 and is currently estimated at $668,141, approximately $274 per square foot. 7705 Pine Isle Ct is a home located in Hamilton County with nearby schools including Mercer Elementary School, Nagel Middle School, and Turpin High School.
Ownership History
Date
Name
Owned For
Owner Type
Purchase Details
Closed on
Oct 7, 2021
Sold by
Tillinghast Helga M
Bought by
Tillinghast Helga M and The Helga M Tillinghast Family
Current Estimated Value
Purchase Details
Closed on
Sep 23, 2020
Sold by
Steiner Edward E and Estate Of Walter L Rye
Bought by
Tillinghast Helga M
Purchase Details
Closed on
May 5, 2006
Sold by
Whitehead Ralph E and Whitehead Katherine A
Bought by
Rye Walter L and Tillinghast Helga M
Purchase Details
Closed on
Nov 6, 2000
Sold by
Rabe Maureen T
Bought by
Whitehead Ralph E and Whitehead Katherine A
Home Financials for this Owner
Home Financials are based on the most recent Mortgage that was taken out on this home.
Original Mortgage
$140,000
Interest Rate
7.91%
Purchase Details
Closed on
Sep 18, 1998
Sold by
Doyle William J and Doyle Joan M
Bought by
Rabe Maureen T
Create a Home Valuation Report for This Property
The Home Valuation Report is an in-depth analysis detailing your home's value as well as a comparison with similar homes in the area
Home Values in the Area
Average Home Value in this Area
Purchase History
| Date | Buyer | Sale Price | Title Company |
|---|---|---|---|
| Tillinghast Helga M | -- | None Available | |
| Tillinghast Helga M | $200,000 | None Available | |
| Rye Walter L | $428,100 | None Available | |
| Whitehead Ralph E | $356,000 | -- | |
| Rabe Maureen T | $351,500 | -- |
Source: Public Records
Mortgage History
| Date | Status | Borrower | Loan Amount |
|---|---|---|---|
| Previous Owner | Whitehead Ralph E | $140,000 |
Source: Public Records
Tax History
| Year | Tax Paid | Tax Assessment Tax Assessment Total Assessment is a certain percentage of the fair market value that is determined by local assessors to be the total taxable value of land and additions on the property. | Land | Improvement |
|---|---|---|---|---|
| 2025 | $9,183 | $162,012 | $26,250 | $135,762 |
| 2023 | $9,050 | $162,012 | $26,250 | $135,762 |
| 2022 | $8,741 | $139,619 | $24,990 | $114,629 |
| 2021 | $8,510 | $139,619 | $24,990 | $114,629 |
| 2020 | $8,078 | $139,619 | $24,990 | $114,629 |
| 2019 | $7,337 | $117,327 | $21,000 | $96,327 |
| 2018 | $6,851 | $117,327 | $21,000 | $96,327 |
| 2017 | $6,494 | $117,327 | $21,000 | $96,327 |
| 2016 | $7,300 | $128,009 | $35,350 | $92,659 |
| 2015 | $7,540 | $128,009 | $35,350 | $92,659 |
| 2014 | $7,548 | $128,009 | $35,350 | $92,659 |
| 2013 | $7,026 | $126,742 | $35,000 | $91,742 |
Source: Public Records
Map
Nearby Homes
- 3420 Oyster Bay Ct
- 3130 Wolf Run Ct
- 3305 Scioto Dr
- 0 Pearl St Unit 1225343
- 0 Pearl St Unit 1841806
- 8288 Bridle Rd
- 7886 Woodstone Dr
- 2700 Little Dry Run Rd
- 6912 Edith St
- 2911 Perthwood Dr
- 6809 Jefferson St
- 7481 Heatherwood Ln
- 2559 Concordgreen Dr
- 6716 Treeridge Dr
- 1 Mt Carmel Rd
- 2 Mount Carmel Rd
- 7392 Hunley Rd
- 7967 Kimbee Dr
- 2274 Pointe Place
- 2282 Berrywood Dr
- 7701 Pine Isle Ct
- 7713 Pine Isle Ct
- 7721 Pine Isle Ct
- 7737 Pine Isle Ct
- 7700 Oyster Bay Ln
- 7708 Oyster Bay Ln
- 7729 Pine Isle Ct
- 7716 Oyster Bay Ln
- 7724 Oyster Bay Ln
- 7745 Oyster Bay Ln
- 3455 Oyster Bay Ct
- 3445 Oyster Bay Ct
- 7732 Oyster Bay Ln
- 7740 Oyster Bay Ln
- 3435 Oyster Bay Ct
- 7753 Oyster Bay Ln
- 3425 Oyster Bay Ct
- 7748 Oyster Bay Ln
- 3440 Oyster Bay Ct
- 3415 Oyster Bay Ct
Your Personal Tour Guide
Ask me questions while you tour the home.