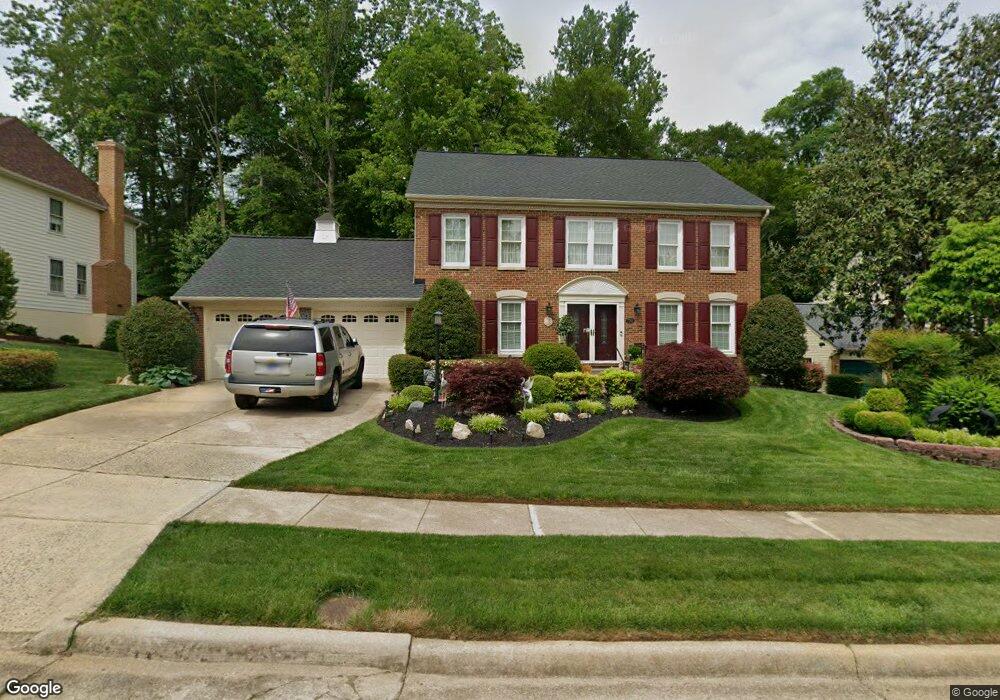
7705 Wilbur Ct Springfield, VA 22153
Estimated Value: $1,016,000 - $1,093,000
5
Beds
4
Baths
2,850
Sq Ft
$371/Sq Ft
Est. Value
About This Home
This home is located at 7705 Wilbur Ct, Springfield, VA 22153 and is currently estimated at $1,056,375, approximately $370 per square foot. 7705 Wilbur Ct is a home located in Fairfax County with nearby schools including Sangster Elementary School, Lake Braddock Secondary School, and Sydenstricker School.
Ownership History
Date
Name
Owned For
Owner Type
Purchase Details
Closed on
Jan 3, 2024
Sold by
Roberton R Michael
Bought by
R Michael Robertson Trust and Robertson
Current Estimated Value
Purchase Details
Closed on
Jan 18, 1985
Bought by
And Robertson R and And Kay T
Create a Home Valuation Report for This Property
The Home Valuation Report is an in-depth analysis detailing your home's value as well as a comparison with similar homes in the area
Home Values in the Area
Average Home Value in this Area
Purchase History
| Date | Buyer | Sale Price | Title Company |
|---|---|---|---|
| R Michael Robertson Trust | -- | None Listed On Document | |
| R Michael Robertson Trust | -- | None Listed On Document | |
| And Robertson R | $174,200 | -- |
Source: Public Records
Tax History Compared to Growth
Tax History
| Year | Tax Paid | Tax Assessment Tax Assessment Total Assessment is a certain percentage of the fair market value that is determined by local assessors to be the total taxable value of land and additions on the property. | Land | Improvement |
|---|---|---|---|---|
| 2025 | $11,030 | $993,710 | $341,000 | $652,710 |
| 2024 | $11,030 | $952,090 | $326,000 | $626,090 |
| 2023 | $10,478 | $928,460 | $326,000 | $602,460 |
| 2022 | $9,668 | $845,510 | $291,000 | $554,510 |
| 2021 | $8,362 | $712,530 | $246,000 | $466,530 |
| 2020 | $8,244 | $696,540 | $241,000 | $455,540 |
| 2019 | $8,519 | $719,850 | $241,000 | $478,850 |
| 2018 | $7,901 | $687,050 | $231,000 | $456,050 |
| 2017 | $7,977 | $687,050 | $231,000 | $456,050 |
| 2016 | $8,086 | $697,960 | $231,000 | $466,960 |
| 2015 | $7,561 | $677,540 | $231,000 | $446,540 |
| 2014 | $7,323 | $657,670 | $221,000 | $436,670 |
Source: Public Records
Map
Nearby Homes
- 8004 Chippenham Ct
- 9419 Braymore Cir
- 8003 Comerford Dr
- 9705 Rambling Ridge Ct
- 9211 Bexleywood Ct
- 7411 Reservation Dr
- 9616 Burnt Oak Dr
- 7753 Northedge Ct
- 9849 S Park Cir
- 7706 Woodshade Ct
- 7209 Reservation Dr
- 9007 Golden Sunset Ln
- 8106 Oak Hollow Ct
- 7917 Valleyfield Dr
- 8017 Galla Knoll Cir
- 9211 Beachway Ln
- 8011 Treasure Tree Ct
- 9032 Golden Leaf Ct
- 8914 Gutman Ct
- 8015 Steeple Chase Ct
- 7703 Wilbur Ct
- 7707 Wilbur Ct
- 7704 Wilbur Ct
- 7803 Huntsman Blvd
- 7702 Wilbur Ct
- 7709 Wilbur Ct
- 7801 Huntsman Blvd
- 7700 Wilbur Ct
- 7731 Huntsman Blvd
- 7729 Huntsman Blvd
- 7710 Wilbur Ct
- 7708 Wilbur Ct
- 7813 Huntsman Blvd
- 7811 Huntsman Blvd
- 7706 Wilbur Ct
- 7727 Huntsman Blvd
- 7806 Huntsman Blvd
- 7808 Huntsman Blvd
- 7804 Huntsman Blvd
- 7810 Huntsman Blvd