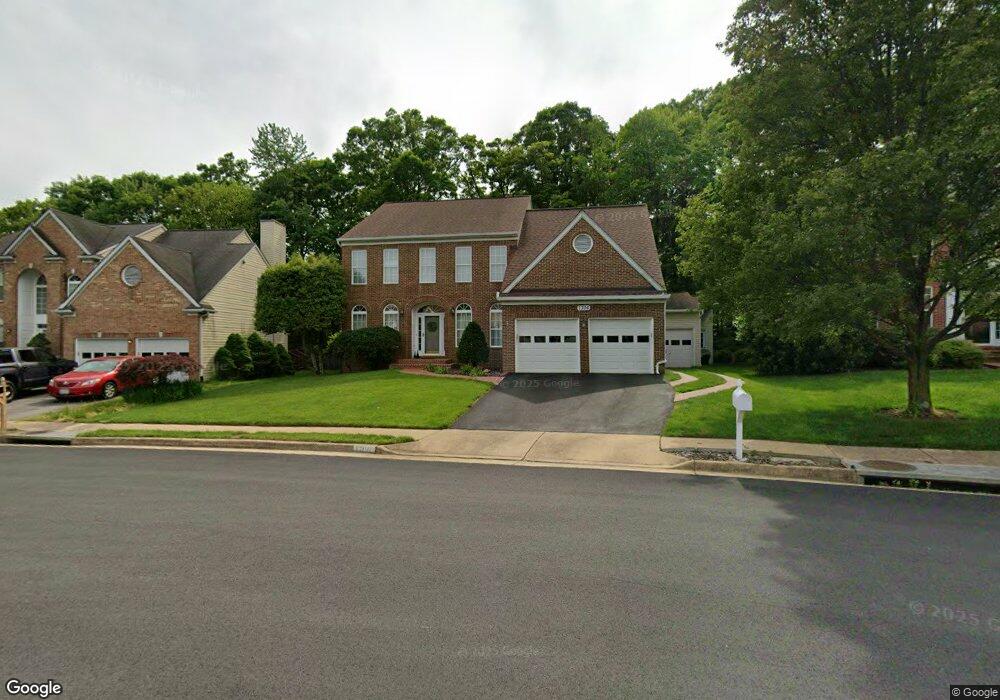
7706 Royal Azalea Ct Springfield, VA 22153
Estimated Value: $1,007,690 - $1,078,000
4
Beds
4
Baths
2,641
Sq Ft
$390/Sq Ft
Est. Value
About This Home
This home is located at 7706 Royal Azalea Ct, Springfield, VA 22153 and is currently estimated at $1,030,923, approximately $390 per square foot. 7706 Royal Azalea Ct is a home located in Fairfax County with nearby schools including Orange Hunt Elementary School, Irving Middle School, and West Springfield High School.
Ownership History
Date
Name
Owned For
Owner Type
Purchase Details
Closed on
Aug 20, 2025
Sold by
Mccreight Richard D and Mccreight Sharon R
Bought by
Mccreight Family Trust and Mccreight
Current Estimated Value
Purchase Details
Closed on
Nov 15, 2004
Sold by
Hammond Louis A
Bought by
Mccreight Richard D
Home Financials for this Owner
Home Financials are based on the most recent Mortgage that was taken out on this home.
Original Mortgage
$420,775
Interest Rate
5.75%
Mortgage Type
New Conventional
Purchase Details
Closed on
May 2, 1994
Sold by
Centex Real Estate Corp
Bought by
Hammond Louis A
Home Financials for this Owner
Home Financials are based on the most recent Mortgage that was taken out on this home.
Original Mortgage
$211,000
Interest Rate
7.7%
Create a Home Valuation Report for This Property
The Home Valuation Report is an in-depth analysis detailing your home's value as well as a comparison with similar homes in the area
Home Values in the Area
Average Home Value in this Area
Purchase History
| Date | Buyer | Sale Price | Title Company |
|---|---|---|---|
| Mccreight Family Trust | -- | None Listed On Document | |
| Mccreight Richard D | $710,775 | -- | |
| Hammond Louis A | $264,030 | -- |
Source: Public Records
Mortgage History
| Date | Status | Borrower | Loan Amount |
|---|---|---|---|
| Previous Owner | Mccreight Richard D | $420,775 | |
| Previous Owner | Hammond Louis A | $211,000 |
Source: Public Records
Tax History Compared to Growth
Tax History
| Year | Tax Paid | Tax Assessment Tax Assessment Total Assessment is a certain percentage of the fair market value that is determined by local assessors to be the total taxable value of land and additions on the property. | Land | Improvement |
|---|---|---|---|---|
| 2025 | $11,083 | $966,820 | $314,000 | $652,820 |
| 2024 | $11,083 | $956,630 | $314,000 | $642,630 |
| 2023 | $9,666 | $856,520 | $284,000 | $572,520 |
| 2022 | $9,395 | $821,570 | $279,000 | $542,570 |
| 2021 | $8,697 | $741,100 | $249,000 | $492,100 |
| 2020 | $8,351 | $705,640 | $249,000 | $456,640 |
| 2019 | $8,191 | $692,100 | $244,000 | $448,100 |
| 2018 | $7,959 | $692,100 | $244,000 | $448,100 |
| 2017 | $7,781 | $670,160 | $234,000 | $436,160 |
| 2016 | $7,808 | $673,940 | $234,000 | $439,940 |
| 2015 | $7,465 | $668,940 | $229,000 | $439,940 |
| 2014 | $7,195 | $646,130 | $219,000 | $427,130 |
Source: Public Records
Map
Nearby Homes
- 9019 Octavia Ct
- 8852 Eagle Rock Ln
- 7676 Green Garland Dr
- 8840 Eagle Rock Ln
- 8011 Treasure Tree Ct
- 8740 Cold Plain Ct
- 7310 Glendower Ct
- 8580 Tyrolean Way
- 7808 Tower Woods Dr
- 7222 Willow Oak Place
- 7757 Tara Heights Place
- 8420 Sweet Pine Ct
- 7411 Reservation Dr
- 8110 Winter Blue Ct
- 8812 Skyron Place
- 8375 Magic Leaf Rd
- 8757 Southern Oaks Place
- 8761 Southern Oaks Place
- The Grant Plan at Southern Oaks Reserve
- The Taylor Plan at Southern Oaks Reserve
- 7704 Royal Azalea Ct
- 7708 Royal Azalea Ct
- 7702 Royal Azalea Ct
- 7710 Royal Azalea Ct
- 7703 Royal Azalea Ct
- 7713 Maritime Ln
- 7711 Maritime Ln
- 7715 Maritime Ln
- 7716 Royal Azalea Ct
- 7707 Royal Azalea Ct
- 7715 Royal Azalea Ct
- 8917 Peoria Ct
- 7717 Maritime Ln
- 7712 Royal Azalea Ct
- 8921 Peoria Ct
- 7701 Royal Azalea Ct
- 8925 Peoria Ct
- 7714 Royal Azalea Ct
- 8909 Peoria Ct
- 7719 Maritime Ln