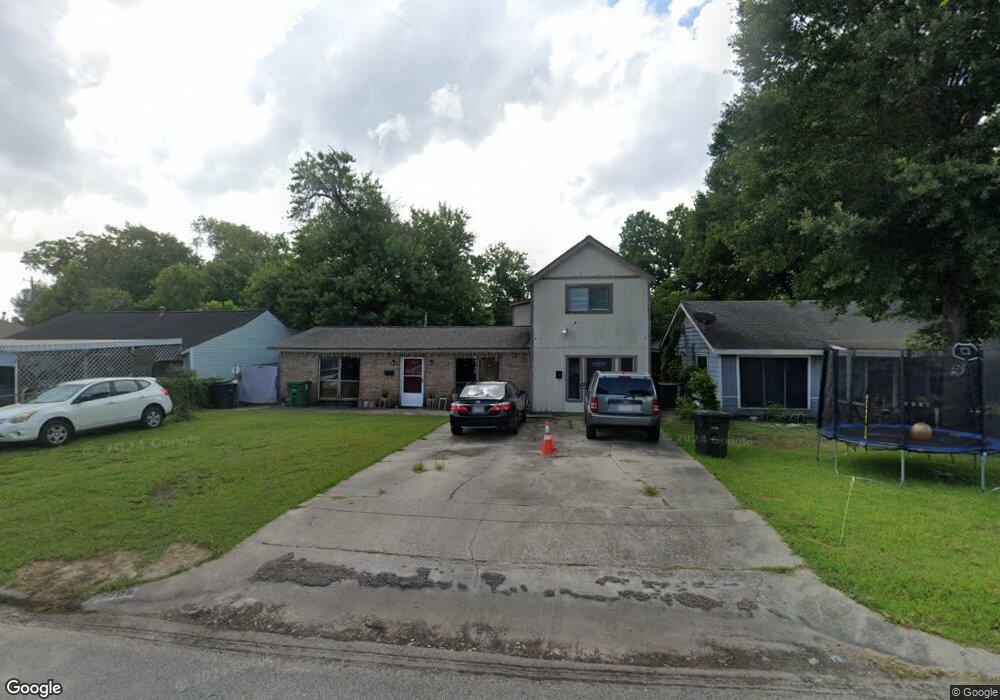
7706 Thurow St Houston, TX 77087
Golfcrest-Bellfort-Reveille NeighborhoodEstimated Value: $226,000 - $357,000
4
Beds
3
Baths
3,279
Sq Ft
$85/Sq Ft
Est. Value
About This Home
This home is located at 7706 Thurow St, Houston, TX 77087 and is currently estimated at $279,205, approximately $85 per square foot. 7706 Thurow St is a home located in Harris County with nearby schools including Golfcrest Elementary School, Hartman Middle School, and Ross Shaw Sterling Aviation High School.
Ownership History
Date
Name
Owned For
Owner Type
Purchase Details
Closed on
Sep 25, 2025
Sold by
Gomez Gonzalo and Gomez Rosalinda
Bought by
Star Apartments Inc
Current Estimated Value
Purchase Details
Closed on
Apr 24, 2008
Sold by
Gomez Gonzalo and Gomez Rosalinda
Bought by
Star Apartments Inc
Purchase Details
Closed on
Jan 3, 2008
Sold by
Star Apartments Inc
Bought by
Gomez Gonzalo
Purchase Details
Closed on
Dec 30, 2003
Sold by
Salazar Otoniel and Salazar Diana A
Bought by
Star Apartments Inc
Purchase Details
Closed on
May 31, 1999
Sold by
Salazar Properties
Bought by
Salazar Otoniel and Salazar Diana A
Purchase Details
Closed on
Jul 31, 1998
Sold by
Delarosa Cennie C Holbrook
Bought by
Salazar Properties
Purchase Details
Closed on
Jul 9, 1998
Sold by
Holbrook Boyd
Bought by
Holbrook Cennie C
Create a Home Valuation Report for This Property
The Home Valuation Report is an in-depth analysis detailing your home's value as well as a comparison with similar homes in the area
Home Values in the Area
Average Home Value in this Area
Purchase History
| Date | Buyer | Sale Price | Title Company |
|---|---|---|---|
| Star Apartments Inc | -- | None Listed On Document | |
| Star Apartments Inc | -- | None Available | |
| Gomez Gonzalo | -- | Chicago Title Insurance Co | |
| Star Apartments Inc | -- | -- | |
| Salazar Otoniel | -- | -- | |
| Salazar Properties | -- | Regency Title | |
| Holbrook Cennie C | -- | Regency Title |
Source: Public Records
Tax History Compared to Growth
Tax History
| Year | Tax Paid | Tax Assessment Tax Assessment Total Assessment is a certain percentage of the fair market value that is determined by local assessors to be the total taxable value of land and additions on the property. | Land | Improvement |
|---|---|---|---|---|
| 2025 | $4,504 | $216,894 | $50,039 | $166,855 |
| 2024 | $4,504 | $215,258 | $43,784 | $171,474 |
| 2023 | $4,504 | $204,282 | $43,784 | $160,498 |
| 2022 | $3,895 | $176,890 | $43,784 | $133,106 |
| 2021 | $4,244 | $182,096 | $25,019 | $157,077 |
| 2020 | $3,536 | $146,000 | $18,764 | $127,236 |
| 2019 | $2,455 | $118,580 | $18,764 | $99,816 |
| 2018 | $2,459 | $97,193 | $18,764 | $78,429 |
| 2017 | $2,458 | $97,193 | $18,764 | $78,429 |
| 2016 | $2,064 | $81,615 | $18,764 | $62,851 |
| 2015 | $1,979 | $77,000 | $18,764 | $58,236 |
| 2014 | $1,979 | $77,000 | $18,764 | $58,236 |
Source: Public Records
Map
Nearby Homes
- 7703 Mchenry St
- 7659 Greenstone St
- 7546 Greendowns St
- 7543 Greenstone St
- 7313 Gulf Fwy Unit 814
- 7313 Gulf Fwy Unit 911
- 7313 Gulf Fwy Unit 1011
- 7303 Gulf Fwy Unit 903
- 7507 Greenstone St
- 3607 De Leon St
- 7937 Grafton St
- 7393 Fairway Dr Unit B
- 3731 Reveille St
- 7318 Thurow St
- 8023 Findlay St
- 2618 Woodridge Manor Dr
- 2511 Evergreen Dr
- 7019 Woodridge Square Dr
- 7007 Woodridge Square Dr
- 3743 Erie St
- 7702 Thurow St
- 7710 Thurow St
- 7642 Thurow St Unit 775
- 7714 Thurow St
- 7638 Thurow St
- 7718 Thurow St Unit 770
- 7707 Thurow St
- 7663 Mchenry St
- 7703 Thurow St
- 7659 Mchenry St
- 7711 Thurow St
- 7667 Mchenry St
- 7643 Thurow St
- 7715 Thurow St
- 7655 Mchenry St
- 7722 Thurow St
- 7634 Thurow St
- 7639 Thurow St
- 7719 Thurow St
- 7651 Mchenry St