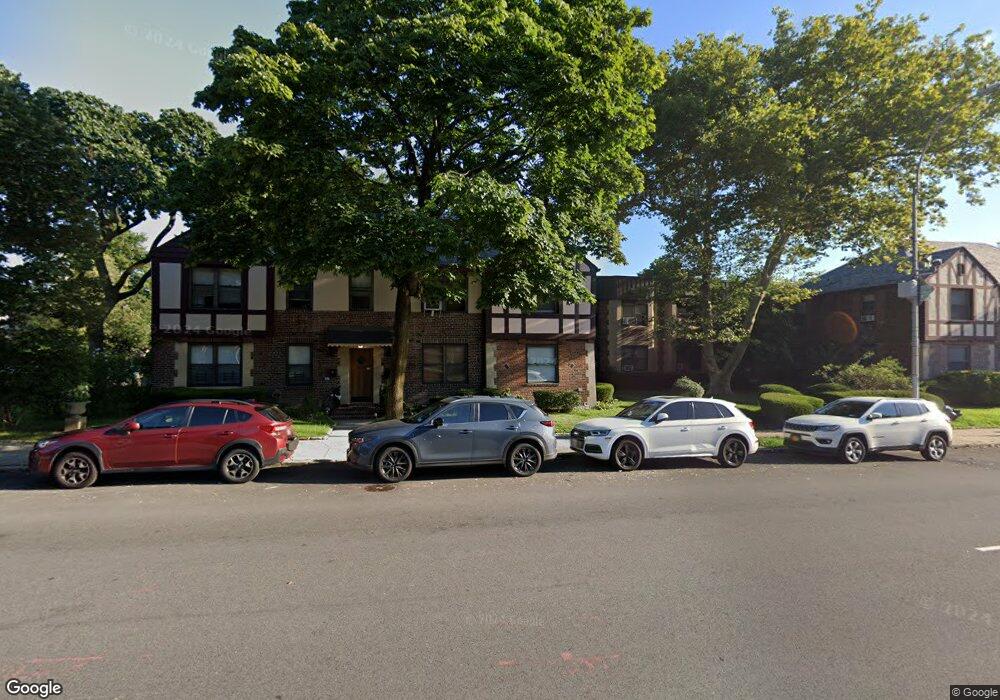
7707 Ditmars Blvd Unit 1 East Elmhurst, NY 11370
Ditmars Steinway NeighborhoodEstimated Value: $326,000 - $429,000
--
Bed
--
Bath
643
Sq Ft
$619/Sq Ft
Est. Value
About This Home
This home is located at 7707 Ditmars Blvd Unit 1, East Elmhurst, NY 11370 and is currently estimated at $397,806, approximately $618 per square foot. 7707 Ditmars Blvd Unit 1 is a home located in Queens County with nearby schools including P.S. 2 Alfred Zimberg, Is 141 The Steinway, and William Cullen Bryant High School.
Ownership History
Date
Name
Owned For
Owner Type
Purchase Details
Closed on
Dec 3, 2014
Sold by
Milone Ralph P
Bought by
Odarchuk Olena and Quijandria Aldo
Current Estimated Value
Home Financials for this Owner
Home Financials are based on the most recent Mortgage that was taken out on this home.
Original Mortgage
$239,200
Outstanding Balance
$182,840
Interest Rate
4.02%
Mortgage Type
New Conventional
Estimated Equity
$214,966
Purchase Details
Closed on
Oct 14, 2005
Sold by
Vidal Monica N and Vidal Julio
Bought by
Milone Ralph P
Home Financials for this Owner
Home Financials are based on the most recent Mortgage that was taken out on this home.
Original Mortgage
$200,000
Interest Rate
5.79%
Mortgage Type
Purchase Money Mortgage
Create a Home Valuation Report for This Property
The Home Valuation Report is an in-depth analysis detailing your home's value as well as a comparison with similar homes in the area
Home Values in the Area
Average Home Value in this Area
Purchase History
| Date | Buyer | Sale Price | Title Company |
|---|---|---|---|
| Odarchuk Olena | $299,000 | -- | |
| Odarchuk Olena | $299,000 | -- | |
| Milone Ralph P | $300,000 | -- | |
| Milone Ralph P | $300,000 | -- |
Source: Public Records
Mortgage History
| Date | Status | Borrower | Loan Amount |
|---|---|---|---|
| Open | Odarchuk Olena | $239,200 | |
| Closed | Odarchuk Olena | $239,200 | |
| Previous Owner | Milone Ralph P | $200,000 |
Source: Public Records
Tax History Compared to Growth
Tax History
| Year | Tax Paid | Tax Assessment Tax Assessment Total Assessment is a certain percentage of the fair market value that is determined by local assessors to be the total taxable value of land and additions on the property. | Land | Improvement |
|---|---|---|---|---|
| 2025 | $4,013 | $32,015 | $5,385 | $26,630 |
| 2024 | $4,013 | $32,096 | $5,385 | $26,711 |
| 2023 | $3,956 | $31,644 | $5,385 | $26,259 |
| 2022 | $2,759 | $31,363 | $5,385 | $25,978 |
| 2021 | $2,715 | $30,788 | $5,385 | $25,403 |
| 2020 | $2,722 | $34,083 | $5,385 | $28,698 |
| 2019 | $2,534 | $33,402 | $5,385 | $28,017 |
| 2018 | $3,213 | $25,264 | $5,386 | $19,878 |
| 2017 | $2,855 | $22,416 | $5,385 | $17,031 |
| 2016 | $2,366 | $22,416 | $5,385 | $17,031 |
| 2015 | $1,222 | $19,076 | $5,385 | $13,691 |
| 2014 | $1,222 | $17,683 | $5,385 | $12,298 |
Source: Public Records
Map
Nearby Homes
- 21-40 78th St Unit 2
- 21-16 77 Street 2nd Floor
- 76-12 Ditmars Blvd Unit B3
- 2209 76th St Unit C2
- 2220 78th St Unit A3
- 22-27 76 St Unit B2
- 2208 76th St Unit A3
- 22-28 77th St Unit C1
- 22-39 78 St
- 22-31 77th St Unit C2
- 21-14 80th St
- 19-65 79th St Unit 2C
- 21-43 80th St
- 2205 80th St
- 2255 78th St Unit 2E
- 2230 75th St
- 2134 74th St
- 1950 80th St Unit 1
- 19-50 80th St Unit 1
- 22-40 80th St Unit 2B
- 7707 Ditmars Blvd Unit C-1
- 7707 Ditmars Blvd Unit 2
- 7707 Ditmars Blvd
- 7707 Ditmars Blvd Unit 2C
- 7707 Ditmars Blvd
- 77- 7 Ditmars Blvd Unit 1
- 7703 Ditmars Blvd
- 7703 Ditmars Blvd Unit 2
- 7703 Ditmars Blvd Unit 1
- 77-09 Ditmars Blvd Unit 2
- 7709 Ditmars Blvd Unit 2
- 7709 Ditmars Blvd Unit 1
- 7711 Ditmars Blvd Unit 2
- 7711 Ditmars Blvd Unit 1
- 7711 Ditmars Blvd
- 77-03 Ditmars Blvd
- 7713 Ditmars Blvd Unit 2
- 7713 Ditmars Blvd Unit 1
- 77-13 Ditmars Blvd