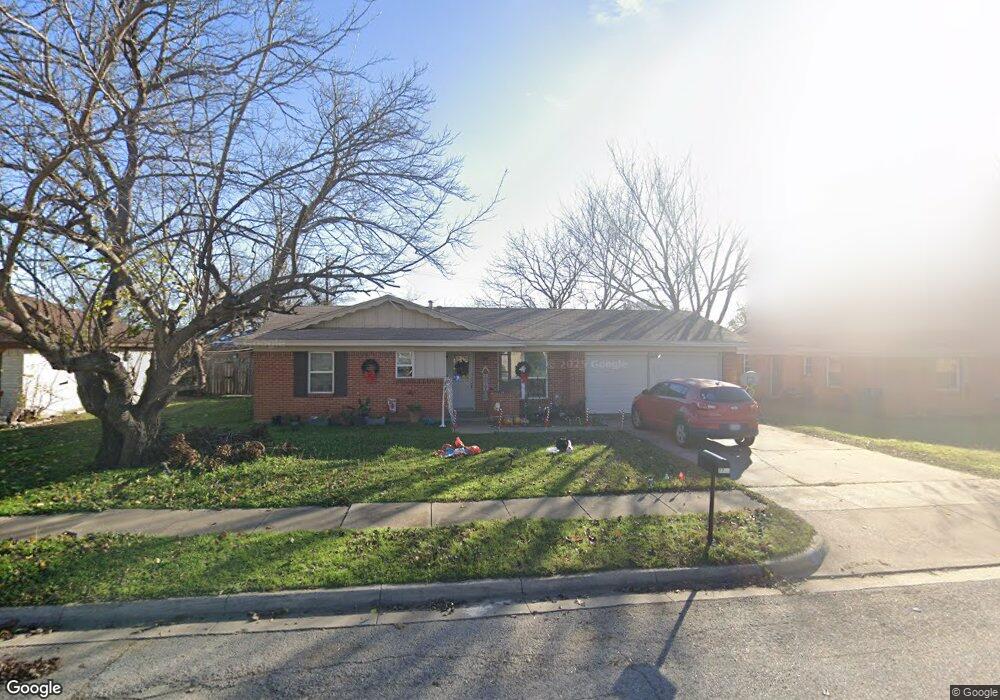
7708 Clenis Ln North Richland Hills, TX 76180
Estimated Value: $214,000 - $255,000
3
Beds
1
Bath
997
Sq Ft
$228/Sq Ft
Est. Value
About This Home
This home is located at 7708 Clenis Ln, North Richland Hills, TX 76180 and is currently estimated at $227,258, approximately $227 per square foot. 7708 Clenis Ln is a home located in Tarrant County with nearby schools including Holiday Heights Elementary School, North Richland Middle School, and Richland High School.
Ownership History
Date
Name
Owned For
Owner Type
Purchase Details
Closed on
Jun 16, 2021
Sold by
True North Property Owner A Llc
Bought by
True North Property Owner A Llc
Current Estimated Value
Purchase Details
Closed on
Jun 30, 2016
Sold by
Wilmington Savings Fund Society Fsb
Bought by
Pretium Sfr Holding Llc
Purchase Details
Closed on
Sep 8, 2015
Sold by
Allen Summer
Bought by
Wilmington Savings Fund Society Fsb and Christiana Trust
Purchase Details
Closed on
Apr 26, 2006
Sold by
Marsh Stanley
Bought by
Allen Summer
Home Financials for this Owner
Home Financials are based on the most recent Mortgage that was taken out on this home.
Original Mortgage
$60,000
Interest Rate
7.5%
Mortgage Type
Purchase Money Mortgage
Purchase Details
Closed on
Jul 24, 2002
Sold by
Covenant Funding Group Inc
Bought by
Marsh 3 Stanley and Mary Kathrine Marsh Management Trust
Create a Home Valuation Report for This Property
The Home Valuation Report is an in-depth analysis detailing your home's value as well as a comparison with similar homes in the area
Home Values in the Area
Average Home Value in this Area
Purchase History
| Date | Buyer | Sale Price | Title Company |
|---|---|---|---|
| True North Property Owner A Llc | -- | Servicelink Title | |
| Pretium Sfr Holding Llc | -- | Attorney | |
| Wilmington Savings Fund Society Fsb | $100,000 | None Available | |
| Allen Summer | -- | Alamo Title Company | |
| Marsh 3 Stanley | -- | Blue Star Title Inc | |
| Covenant Funding Group Inc | -- | Blue Star Title Inc |
Source: Public Records
Mortgage History
| Date | Status | Borrower | Loan Amount |
|---|---|---|---|
| Previous Owner | Allen Summer | $60,000 |
Source: Public Records
Tax History Compared to Growth
Tax History
| Year | Tax Paid | Tax Assessment Tax Assessment Total Assessment is a certain percentage of the fair market value that is determined by local assessors to be the total taxable value of land and additions on the property. | Land | Improvement |
|---|---|---|---|---|
| 2025 | $4,155 | $158,679 | $50,000 | $108,679 |
| 2024 | $4,155 | $191,486 | $50,000 | $141,486 |
| 2023 | $4,515 | $205,807 | $50,000 | $155,807 |
| 2022 | $4,257 | $176,904 | $30,000 | $146,904 |
| 2021 | $3,028 | $119,000 | $30,000 | $89,000 |
| 2020 | $3,028 | $119,000 | $30,000 | $89,000 |
| 2019 | $3,134 | $119,000 | $30,000 | $89,000 |
| 2018 | $2,603 | $98,862 | $30,000 | $68,862 |
| 2017 | $2,841 | $105,600 | $30,000 | $75,600 |
| 2016 | $2,707 | $100,605 | $20,000 | $80,605 |
| 2015 | $1,692 | $63,000 | $16,000 | $47,000 |
| 2014 | $1,692 | $63,000 | $16,000 | $47,000 |
Source: Public Records
Map
Nearby Homes
- 4916 Susan Lee Ln
- 5024 Maryanna Way
- 5016 Winder Ct
- 5117 Maryanna Way
- 7717 Janetta Dr
- 7908 Lazy Lane Rd
- 5113 Bob Dr
- 7409 Jade Cir
- 8020 Laura St
- 5320 Topper Dr
- 4540 Ward St
- 5336 Davis Blvd
- 7501 Lola Dr
- Dalton II Plan at City Point
- Zoe Plan at City Point
- Hampton Plan at City Point
- Conrad Plan at City Point
- 7521 Susan Ct
- 7529 Susan Ct
- 4529 Ward St