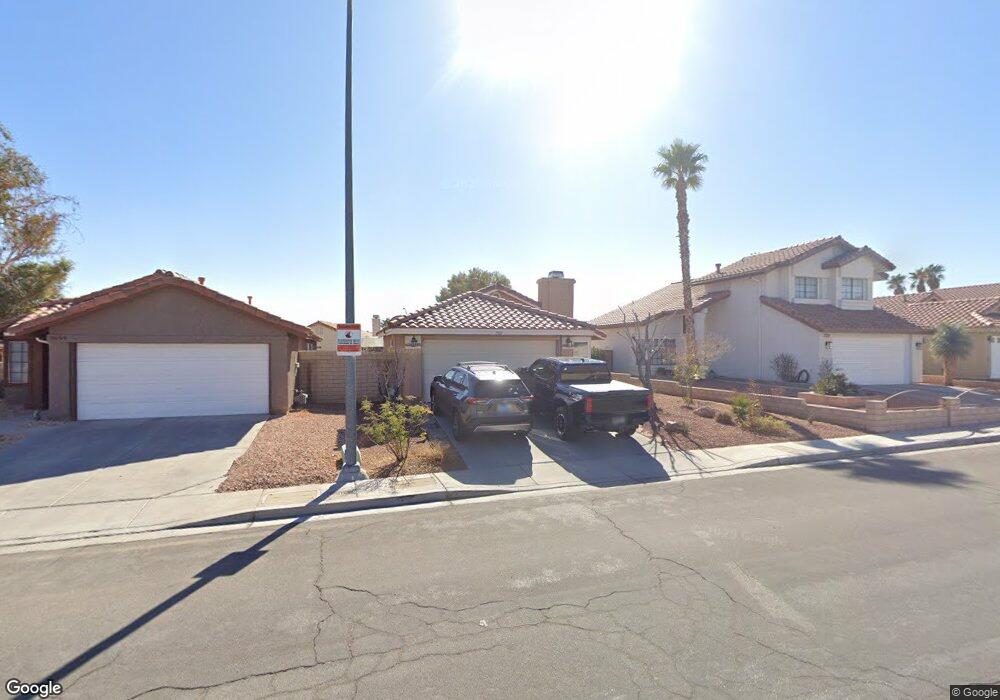
7709 Marmot Ave Las Vegas, NV 89147
Estimated Value: $350,000 - $389,000
2
Beds
2
Baths
1,050
Sq Ft
$347/Sq Ft
Est. Value
About This Home
This home is located at 7709 Marmot Ave, Las Vegas, NV 89147 and is currently estimated at $364,166, approximately $346 per square foot. 7709 Marmot Ave is a home located in Clark County with nearby schools including Frank Kim Elementary School, Clifford J Lawrence Junior High School, and Durango High School.
Ownership History
Date
Name
Owned For
Owner Type
Purchase Details
Closed on
Feb 22, 2019
Sold by
Rawlings Liann J and Rawlings Liann J
Bought by
Rawlings Liann J and Sadleir David J
Current Estimated Value
Home Financials for this Owner
Home Financials are based on the most recent Mortgage that was taken out on this home.
Original Mortgage
$174,000
Outstanding Balance
$111,133
Interest Rate
4.3%
Mortgage Type
New Conventional
Estimated Equity
$253,033
Purchase Details
Closed on
Mar 7, 2005
Sold by
Free Donna L
Bought by
Rawlings Liann J
Home Financials for this Owner
Home Financials are based on the most recent Mortgage that was taken out on this home.
Original Mortgage
$186,800
Interest Rate
6.5%
Mortgage Type
Unknown
Purchase Details
Closed on
Nov 2, 2000
Sold by
Serio Mark F
Bought by
Free Donna L
Home Financials for this Owner
Home Financials are based on the most recent Mortgage that was taken out on this home.
Original Mortgage
$113,068
Interest Rate
7.67%
Mortgage Type
FHA
Create a Home Valuation Report for This Property
The Home Valuation Report is an in-depth analysis detailing your home's value as well as a comparison with similar homes in the area
Home Values in the Area
Average Home Value in this Area
Purchase History
| Date | Buyer | Sale Price | Title Company |
|---|---|---|---|
| Rawlings Liann J | -- | Timios Agency Of Nevada Inc | |
| Rawlings Liann J | $233,500 | Fidelity National Title | |
| Free Donna L | $114,000 | Lawyers Title |
Source: Public Records
Mortgage History
| Date | Status | Borrower | Loan Amount |
|---|---|---|---|
| Open | Rawlings Liann J | $174,000 | |
| Closed | Rawlings Liann J | $186,800 | |
| Previous Owner | Free Donna L | $113,068 | |
| Closed | Free Donna L | $5,700 |
Source: Public Records
Tax History Compared to Growth
Tax History
| Year | Tax Paid | Tax Assessment Tax Assessment Total Assessment is a certain percentage of the fair market value that is determined by local assessors to be the total taxable value of land and additions on the property. | Land | Improvement |
|---|---|---|---|---|
| 2025 | $1,325 | $65,989 | $30,800 | $35,189 |
| 2024 | $1,287 | $65,989 | $30,800 | $35,189 |
| 2023 | $1,287 | $62,109 | $28,350 | $33,759 |
| 2022 | $1,250 | $55,268 | $24,150 | $31,118 |
| 2021 | $1,214 | $51,602 | $21,700 | $29,902 |
| 2020 | $1,175 | $50,146 | $20,300 | $29,846 |
| 2019 | $1,161 | $47,758 | $18,200 | $29,558 |
| 2018 | $1,108 | $43,765 | $15,050 | $28,715 |
| 2017 | $1,280 | $43,638 | $14,350 | $29,288 |
| 2016 | $1,050 | $41,150 | $11,550 | $29,600 |
| 2015 | $1,047 | $37,784 | $8,400 | $29,384 |
| 2014 | $1,016 | $33,830 | $7,700 | $26,130 |
Source: Public Records
Map
Nearby Homes
- 4580 Allenford Dr
- 7777 Barbican Ct
- 4595 Grindle Point St
- 7822 Whitlocks Mill Ave
- 4658 Cosley Dr
- 7547 Kalmalii Ave
- 4725 Cosley Dr
- 7869 Barntucket Ave
- 7729 Rathburn Ave
- 7742 Selby Ct
- 4732 Illustrious St
- 4727 Siegfried St
- 7932 Barntucket Ave
- 4829 Farlington Dr Unit 3B
- 7544 Shangri la Ave
- 4502 New Dupell Way
- 7936 Canto Ave
- 4484 Warbonnet Way
- 7924 Bridgefield Ln
- 7507 Mycroft Ct
- 7719 Marmot Ave
- 7699 Marmot Ave
- 7729 Marmot Ave Unit 3G
- 7689 Marmot Ave
- 7708 Barbican Ct Unit 3E
- 7698 Barbican Ct
- 7718 Barbican Ct
- 4605 Ermine Ct
- 7739 Marmot Ave
- 7728 Barbican Ct
- 4641 Denwood Dr
- 4635 Denwood Dr Unit 3E
- 4599 Ermine Ct
- 4604 Allenford Dr
- 7749 Marmot Ave
- 7749 Marmot Ave Unit n/a
- 4647 Denwood Dr
- 7738 Barbican Ct
- 4600 Ermine Ct
- 4623 Denwood Dr Unit 3E