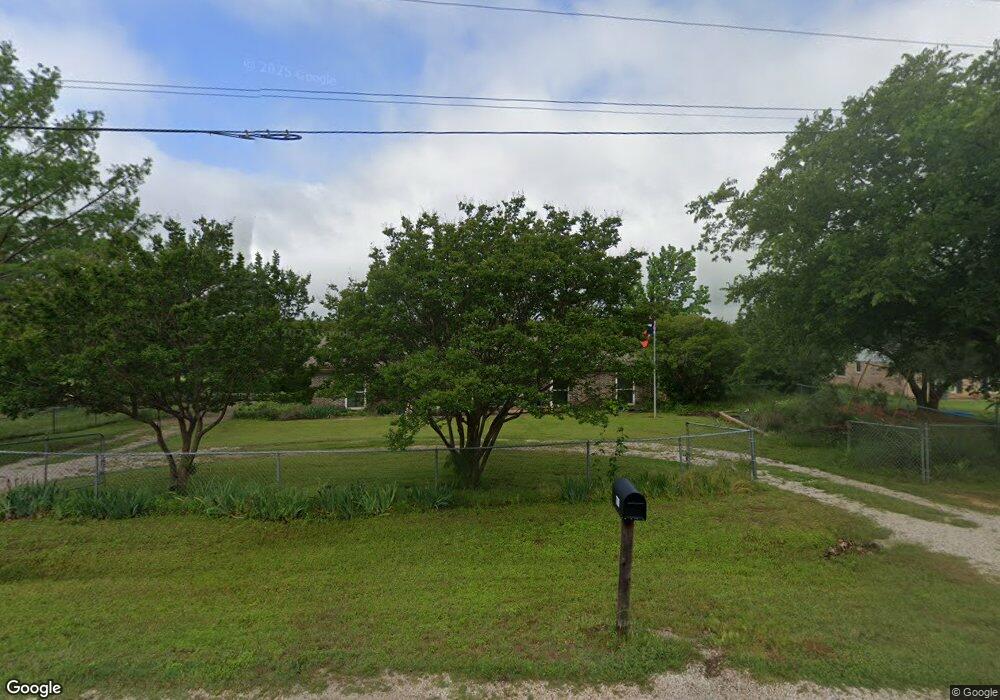
7709 Oak Pkwy Burleson, TX 76028
Osage-North Fisk NeighborhoodEstimated Value: $402,742 - $468,000
3
Beds
2
Baths
1,996
Sq Ft
$218/Sq Ft
Est. Value
About This Home
This home is located at 7709 Oak Pkwy, Burleson, TX 76028 and is currently estimated at $435,436, approximately $218 per square foot. 7709 Oak Pkwy is a home located in Johnson County with nearby schools including Irene Clinkscale Elementary School, Burleson Centennial High School, and Joshua Adventist Multigrade School.
Ownership History
Date
Name
Owned For
Owner Type
Purchase Details
Closed on
May 27, 2019
Sold by
Chiles Katherine A
Bought by
Bearer Donna J and Chiles Katherine A
Current Estimated Value
Create a Home Valuation Report for This Property
The Home Valuation Report is an in-depth analysis detailing your home's value as well as a comparison with similar homes in the area
Home Values in the Area
Average Home Value in this Area
Purchase History
| Date | Buyer | Sale Price | Title Company |
|---|---|---|---|
| Bearer Donna J | -- | None Available |
Source: Public Records
Tax History Compared to Growth
Tax History
| Year | Tax Paid | Tax Assessment Tax Assessment Total Assessment is a certain percentage of the fair market value that is determined by local assessors to be the total taxable value of land and additions on the property. | Land | Improvement |
|---|---|---|---|---|
| 2025 | $4,559 | $331,131 | $162,590 | $168,541 |
| 2024 | $5,885 | $347,788 | $162,590 | $185,198 |
| 2023 | $4,599 | $347,788 | $162,590 | $185,198 |
| 2022 | $6,670 | $347,788 | $162,590 | $185,198 |
| 2021 | $6,370 | $322,598 | $137,400 | $185,198 |
| 2020 | $6,174 | $322,598 | $137,400 | $185,198 |
| 2019 | $6,019 | $322,598 | $137,400 | $185,198 |
| 2018 | $5,472 | $306,257 | $137,400 | $168,857 |
| 2017 | $4,653 | $252,405 | $105,340 | $147,065 |
| 2016 | $4,230 | $227,215 | $80,150 | $147,065 |
| 2015 | $3,561 | $186,704 | $68,700 | $118,004 |
| 2014 | $3,561 | $186,704 | $68,700 | $118,004 |
Source: Public Records
Map
Nearby Homes
- 2736 County Road 804a
- 7791 Weatherby Rd
- 7480 County Road 802
- 3101 Collins Rd
- 3175 Collins Rd
- 2631 Streamside Dr
- 2629 Streamside Dr
- 3345 Collins Rd
- 2609 Streamside Dr
- 2607 Streamside Dr
- 2637 Streamside Dr
- 3500 Trails End Rd
- 2600 Streamside Dr
- 2629 River Bank
- 2629 Riverbank Dr
- 1188 Oak Spring Dr
- 1180 Oak Spring Dr
- 1184 Oak Spring Dr
- 2673 River Bank Dr
- 1824 Fm 731
- 7707 Oak Pkwy
- 7713 Oak Pkwy
- 7717 Oak Pkwy
- 7705 Oak Pkwy
- 7712 Oak Pkwy
- 7708 Oak Pkwy
- 7721 Oak Pkwy
- 7704 Oak Pkwy
- 7720 Oak Pkwy
- 2716 County Road 804a
- 7700 Oak Pkwy
- 2704 County Road 804a
- 7725 Oak Pkwy
- 2708 Oakridge Rd
- 2728 County Road 804a
- 7801 Oak Pkwy
- 2713 County Road 804a
- 2705 County Road 804a
- 2701 County Road 804a
- 2629 County Road 804a