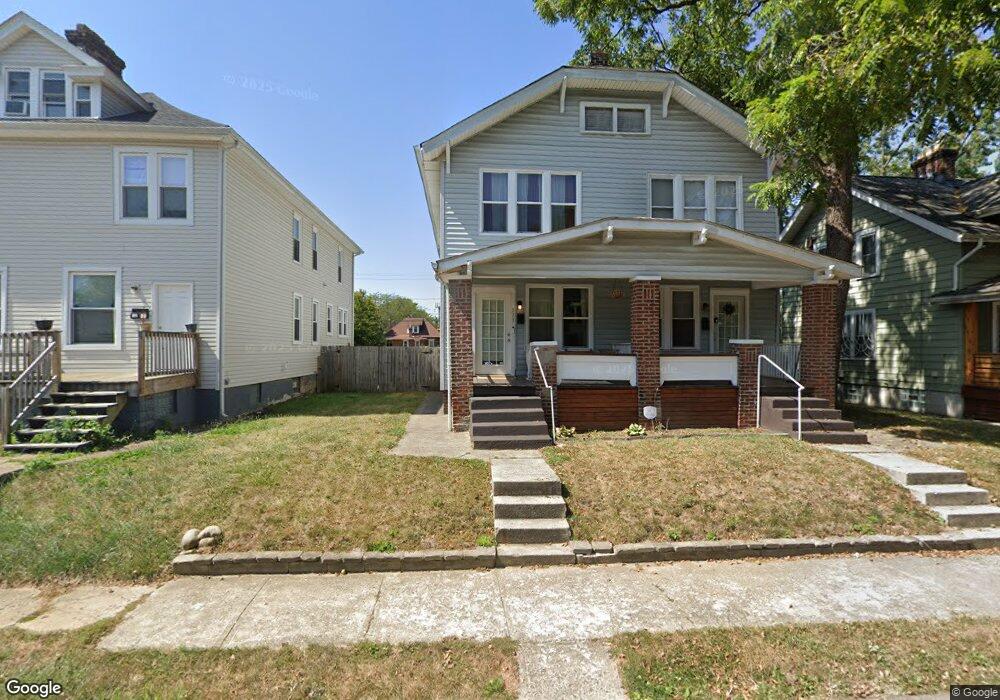
771 Ann St Unit 773 Columbus, OH 43206
Southern Orchards NeighborhoodEstimated Value: $301,468 - $450,000
6
Beds
2
Baths
2,672
Sq Ft
$140/Sq Ft
Est. Value
About This Home
This home is located at 771 Ann St Unit 773, Columbus, OH 43206 and is currently estimated at $373,117, approximately $139 per square foot. 771 Ann St Unit 773 is a home located in Franklin County with nearby schools including Livingston Elementary School, South High School, and South Columbus Preparatory Academy.
Ownership History
Date
Name
Owned For
Owner Type
Purchase Details
Closed on
Feb 18, 2012
Sold by
Marlatt Jennifer D
Bought by
771-3 Ann Llc
Current Estimated Value
Purchase Details
Closed on
Jan 23, 2012
Sold by
Luper Frederick M
Bought by
Marlatt Jennifer D
Purchase Details
Closed on
Feb 11, 2009
Sold by
Secretary Of Housing & Urban Development
Bought by
Mccoy Todd
Purchase Details
Closed on
Oct 18, 2006
Sold by
Woods John
Bought by
Hud
Purchase Details
Closed on
Mar 30, 2005
Sold by
Miller Paulette
Bought by
Woods John
Home Financials for this Owner
Home Financials are based on the most recent Mortgage that was taken out on this home.
Original Mortgage
$84,333
Interest Rate
5.88%
Mortgage Type
FHA
Purchase Details
Closed on
May 23, 1994
Bought by
Miller Paulette
Purchase Details
Closed on
Jul 7, 1992
Create a Home Valuation Report for This Property
The Home Valuation Report is an in-depth analysis detailing your home's value as well as a comparison with similar homes in the area
Home Values in the Area
Average Home Value in this Area
Purchase History
| Date | Buyer | Sale Price | Title Company |
|---|---|---|---|
| 771-3 Ann Llc | -- | Bexley Title | |
| Marlatt Jennifer D | $15,000 | Attorney | |
| Mccoy Todd | $10,000 | Arrow Title | |
| Hud | $92,000 | None Available | |
| Woods John | $85,000 | Lawyers Tit | |
| Miller Paulette | $48,900 | -- | |
| -- | -- | -- |
Source: Public Records
Mortgage History
| Date | Status | Borrower | Loan Amount |
|---|---|---|---|
| Previous Owner | Woods John | $84,333 | |
| Closed | 771-3 Ann Llc | $0 |
Source: Public Records
Tax History Compared to Growth
Tax History
| Year | Tax Paid | Tax Assessment Tax Assessment Total Assessment is a certain percentage of the fair market value that is determined by local assessors to be the total taxable value of land and additions on the property. | Land | Improvement |
|---|---|---|---|---|
| 2024 | $3,746 | $81,730 | $30,940 | $50,790 |
| 2023 | $3,699 | $81,725 | $30,940 | $50,785 |
| 2022 | $1,602 | $30,140 | $4,550 | $25,590 |
| 2021 | $1,605 | $30,140 | $4,550 | $25,590 |
| 2020 | $1,607 | $30,140 | $4,550 | $25,590 |
| 2019 | $1,441 | $23,170 | $3,500 | $19,670 |
| 2018 | $727 | $23,170 | $3,500 | $19,670 |
| 2017 | $1,440 | $23,170 | $3,500 | $19,670 |
| 2016 | $357 | $5,260 | $2,840 | $2,420 |
| 2015 | $171 | $5,260 | $2,840 | $2,420 |
| 2014 | $326 | $5,260 | $2,840 | $2,420 |
| 2013 | $161 | $5,250 | $2,835 | $2,415 |
Source: Public Records
Map
Nearby Homes
- 786 Ann St
- 841 Ann St
- 575 E Columbus St Unit 577
- 517 Forest St
- 667 E Columbus St
- 556 Stanley Ave
- 792 S 18th St
- 644 Stanley Ave
- 561 South Ln
- 497 E Kossuth St
- 490 Stanley Ave
- 596 E Whittier St
- 487 E Beck St
- 901 Heyl Ave
- 432 E Kossuth St
- 486 E Whittier St
- 547 E Whittier St
- 954 S 18th St
- 418 Forest St
- 958 S 18th St