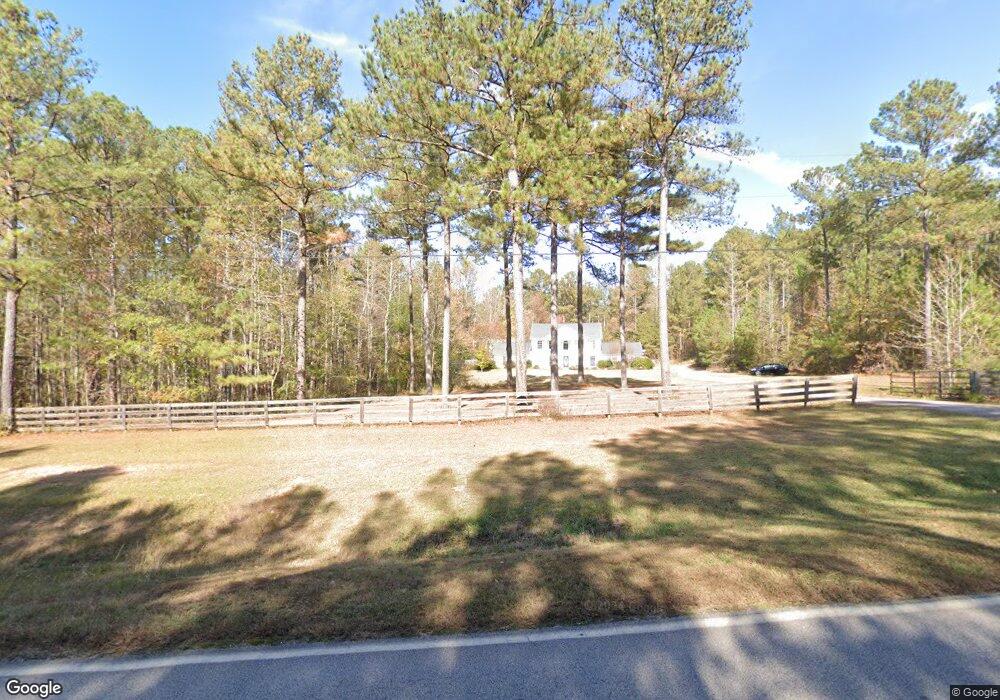
771 Coweta Heard Rd Hogansville, GA 30230
Estimated Value: $459,969 - $659,000
4
Beds
3
Baths
2,802
Sq Ft
$202/Sq Ft
Est. Value
About This Home
This home is located at 771 Coweta Heard Rd, Hogansville, GA 30230 and is currently estimated at $565,992, approximately $201 per square foot. 771 Coweta Heard Rd is a home located in Coweta County with nearby schools including Glanton Elementary School, Smokey Road Middle School, and Newnan High School.
Ownership History
Date
Name
Owned For
Owner Type
Purchase Details
Closed on
Jun 11, 2012
Sold by
Wisniewski David B
Bought by
Wisniewski David B and Wisniewski Patsy R
Current Estimated Value
Home Financials for this Owner
Home Financials are based on the most recent Mortgage that was taken out on this home.
Original Mortgage
$209,050
Outstanding Balance
$145,083
Interest Rate
3.86%
Mortgage Type
New Conventional
Estimated Equity
$420,909
Purchase Details
Closed on
Sep 18, 2002
Sold by
Urban Improvements Ltd
Bought by
Wisniewski David B
Home Financials for this Owner
Home Financials are based on the most recent Mortgage that was taken out on this home.
Original Mortgage
$31,700
Interest Rate
6.3%
Mortgage Type
New Conventional
Purchase Details
Closed on
Nov 15, 2001
Sold by
Ridgeway Land Co
Bought by
Urban Improvments Ltd
Create a Home Valuation Report for This Property
The Home Valuation Report is an in-depth analysis detailing your home's value as well as a comparison with similar homes in the area
Home Values in the Area
Average Home Value in this Area
Purchase History
| Date | Buyer | Sale Price | Title Company |
|---|---|---|---|
| Wisniewski David B | -- | -- | |
| Wisniewski David B | $40,000 | -- | |
| Urban Improvments Ltd | $164,300 | -- |
Source: Public Records
Mortgage History
| Date | Status | Borrower | Loan Amount |
|---|---|---|---|
| Open | Wisniewski David B | $209,050 | |
| Previous Owner | Wisniewski David B | $31,700 |
Source: Public Records
Tax History Compared to Growth
Tax History
| Year | Tax Paid | Tax Assessment Tax Assessment Total Assessment is a certain percentage of the fair market value that is determined by local assessors to be the total taxable value of land and additions on the property. | Land | Improvement |
|---|---|---|---|---|
| 2024 | $2,701 | $159,467 | $30,000 | $129,467 |
| 2023 | $2,701 | $152,032 | $22,000 | $130,032 |
| 2022 | $2,945 | $124,239 | $22,000 | $102,239 |
| 2021 | $2,977 | $117,769 | $14,110 | $103,659 |
| 2020 | $2,996 | $117,769 | $14,110 | $103,659 |
| 2019 | $2,275 | $82,541 | $18,404 | $64,136 |
| 2018 | $2,280 | $82,541 | $18,404 | $64,136 |
| 2017 | $2,279 | $82,541 | $18,404 | $64,137 |
| 2016 | $2,254 | $82,541 | $18,404 | $64,136 |
| 2015 | $2,219 | $82,541 | $18,404 | $64,136 |
| 2014 | $2,203 | $82,541 | $18,404 | $64,136 |
Source: Public Records
Map
Nearby Homes
- 211 Hogan Coweta Rd
- 98 Alexander Rd
- 423 Coweta Heard Rd
- 109 Calico Loop
- 106 Calico Loop
- 545 Minnie Sewell Rd
- 151 Grandma Branch Rd
- 151 Grandma Branch Rd Unit Lot 8
- 260.66 AC Bohannon Rd
- 00 Bohannon Rd
- 515 Bohannon Rd
- 515 Bohannon Rd Unit 13
- 0 Bohannon Rd Unit 24753931
- 0 Bohannon Rd Unit 10471210
- 0 Bohannon Rd Unit 10398969
- 309 Lagrange St
- Cypress Plan at Bohannon Ridge
- Cannaberra Plan at Bohannon Ridge
- Jackson Plan at Bohannon Ridge
- Maple Plan at Bohannon Ridge
- 0 Coweta Heard Rd Unit 2558357
- 0 Coweta Heard Rd Unit 3137192
- 0 Coweta Heard Rd Unit TR 5 3013554
- 0 Coweta Heard Rd Unit TR 6 3013562
- 0 Coweta Heard Rd Unit 7030820
- 0 Coweta Heard Rd Unit 20161063
- 0 Coweta Heard Rd Unit 20140273
- 0 Coweta Heard Rd Unit 20097049
- 0 Coweta Heard Rd Unit 20094005
- 0 Coweta Heard Rd Unit 20015457
- 0 Coweta Heard Rd Unit 8006019
- 797 Coweta Heard Rd
- 80 Hogan Coweta Rd
- 80 Hogan Coweta Rd
- 22 Hogan Coweta Rd Unit 4
- 22 Hogan Coweta Rd
- 22 Hogan Coweta Rd Unit 5.01+/- Acres
- 22 Hogan-Coweta Rd Unit 4
- 845 Coweta Heard Rd
- 120 Hogan Coweta Rd