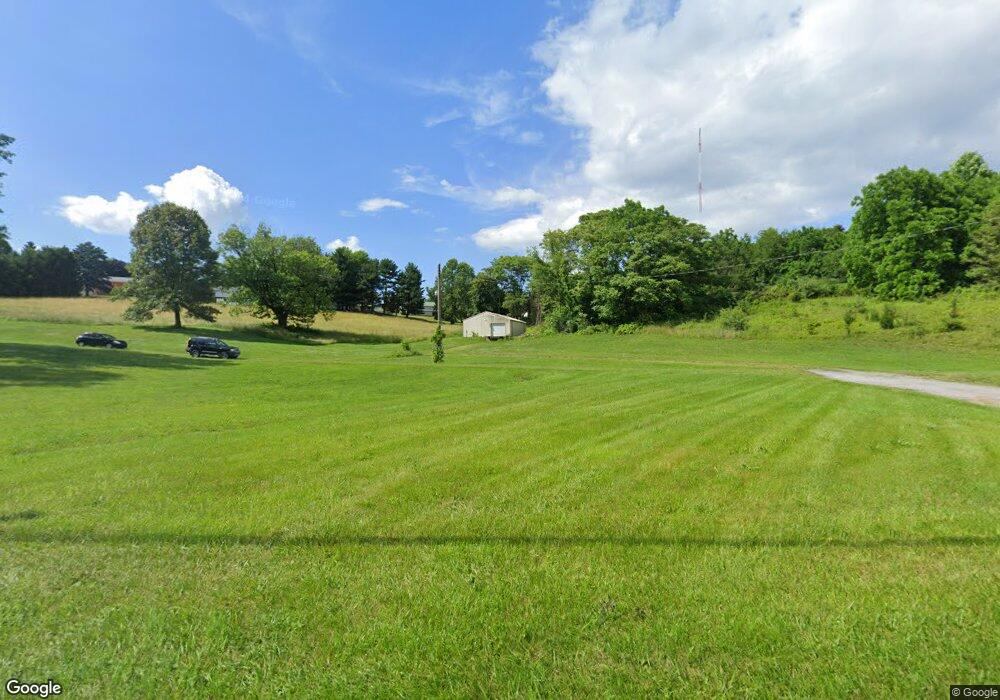
771 Delta Rd Red Lion, PA 17356
Estimated Value: $140,000 - $308,000
3
Beds
1
Bath
1,664
Sq Ft
$135/Sq Ft
Est. Value
About This Home
This home is located at 771 Delta Rd, Red Lion, PA 17356 and is currently estimated at $224,000, approximately $134 per square foot. 771 Delta Rd is a home located in York County with nearby schools including Pleasant View Elementary School, Red Lion Area Junior High School, and Red Lion Area Senior High School.
Ownership History
Date
Name
Owned For
Owner Type
Purchase Details
Closed on
Nov 30, 2011
Sold by
Garry Jan H and Garry Lynn G
Bought by
Dobbie Dennis M and Dobbie Kathy M
Current Estimated Value
Home Financials for this Owner
Home Financials are based on the most recent Mortgage that was taken out on this home.
Original Mortgage
$359,411
Outstanding Balance
$246,921
Interest Rate
4.1%
Mortgage Type
Seller Take Back
Estimated Equity
-$22,921
Purchase Details
Closed on
Jan 1, 1985
Bought by
Garry Jan H and Garry Lynn G
Create a Home Valuation Report for This Property
The Home Valuation Report is an in-depth analysis detailing your home's value as well as a comparison with similar homes in the area
Home Values in the Area
Average Home Value in this Area
Purchase History
| Date | Buyer | Sale Price | Title Company |
|---|---|---|---|
| Dobbie Dennis M | $499,411 | None Available | |
| Garry Jan H | $88,000 | -- |
Source: Public Records
Mortgage History
| Date | Status | Borrower | Loan Amount |
|---|---|---|---|
| Open | Dobbie Dennis M | $359,411 |
Source: Public Records
Tax History Compared to Growth
Tax History
| Year | Tax Paid | Tax Assessment Tax Assessment Total Assessment is a certain percentage of the fair market value that is determined by local assessors to be the total taxable value of land and additions on the property. | Land | Improvement |
|---|---|---|---|---|
| 2025 | $2,559 | $81,850 | $75,580 | $6,270 |
| 2024 | $2,458 | $81,850 | $75,580 | $6,270 |
| 2023 | $2,458 | $81,850 | $75,580 | $6,270 |
| 2022 | $2,458 | $81,850 | $75,580 | $6,270 |
| 2021 | $2,388 | $81,850 | $75,580 | $6,270 |
| 2020 | $2,388 | $81,850 | $75,580 | $6,270 |
| 2019 | $5,321 | $182,980 | $75,580 | $107,400 |
| 2018 | $5,293 | $182,980 | $75,580 | $107,400 |
| 2017 | $5,248 | $182,980 | $75,580 | $107,400 |
| 2016 | $0 | $182,980 | $75,580 | $107,400 |
| 2015 | -- | $182,190 | $74,790 | $107,400 |
| 2014 | -- | $182,190 | $74,790 | $107,400 |
Source: Public Records
Map
Nearby Homes