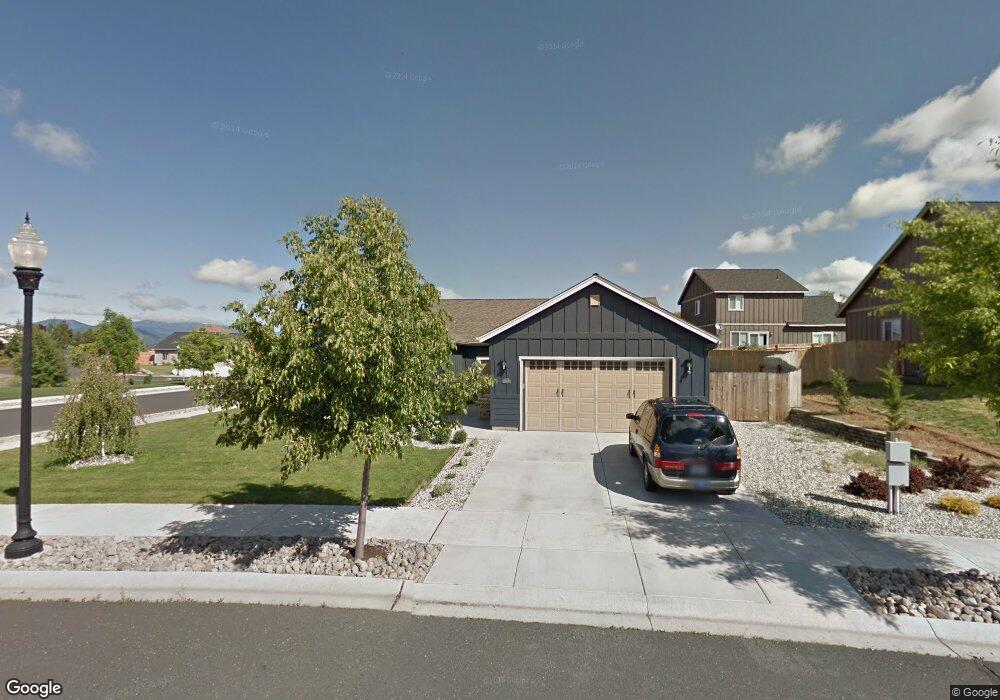
771 Hogue Dr Klamath Falls, OR 97601
Estimated Value: $487,014 - $526,000
3
Beds
2
Baths
1,810
Sq Ft
$280/Sq Ft
Est. Value
About This Home
This home is located at 771 Hogue Dr, Klamath Falls, OR 97601 and is currently estimated at $506,507, approximately $279 per square foot. 771 Hogue Dr is a home located in Klamath County with nearby schools including Pelican Elementary School, Ponderosa Middle School, and Klamath Union High School.
Ownership History
Date
Name
Owned For
Owner Type
Purchase Details
Closed on
Sep 8, 2009
Sold by
Federal Home Loan Mortgage Corporation
Bought by
Nieman Robert D and Nieman Theresa A
Current Estimated Value
Home Financials for this Owner
Home Financials are based on the most recent Mortgage that was taken out on this home.
Original Mortgage
$180,175
Outstanding Balance
$117,774
Interest Rate
5.18%
Mortgage Type
FHA
Estimated Equity
$388,733
Purchase Details
Closed on
Jun 20, 2009
Sold by
Sherwin Danny L and Sherwin Leslie E
Bought by
Federal Home Loan Mortgage Corp
Purchase Details
Closed on
Nov 15, 2006
Sold by
Aspen Tree Homes Llc
Bought by
Sherwin Danny L and Sherwin Leslie E
Home Financials for this Owner
Home Financials are based on the most recent Mortgage that was taken out on this home.
Original Mortgage
$260,950
Interest Rate
6.28%
Mortgage Type
New Conventional
Create a Home Valuation Report for This Property
The Home Valuation Report is an in-depth analysis detailing your home's value as well as a comparison with similar homes in the area
Home Values in the Area
Average Home Value in this Area
Purchase History
| Date | Buyer | Sale Price | Title Company |
|---|---|---|---|
| Nieman Robert D | $183,500 | Service Link | |
| Federal Home Loan Mortgage Corp | $170,736 | Ate | |
| Sherwin Danny L | $97,000 | First American |
Source: Public Records
Mortgage History
| Date | Status | Borrower | Loan Amount |
|---|---|---|---|
| Open | Nieman Robert D | $180,175 | |
| Previous Owner | Sherwin Danny L | $260,950 |
Source: Public Records
Tax History Compared to Growth
Tax History
| Year | Tax Paid | Tax Assessment Tax Assessment Total Assessment is a certain percentage of the fair market value that is determined by local assessors to be the total taxable value of land and additions on the property. | Land | Improvement |
|---|---|---|---|---|
| 2024 | $3,832 | $222,430 | -- | -- |
| 2023 | $3,679 | $222,430 | $0 | $0 |
| 2022 | $3,606 | $209,670 | $0 | $0 |
| 2021 | $3,465 | $203,570 | $0 | $0 |
| 2020 | $3,398 | $197,650 | $0 | $0 |
| 2019 | $3,311 | $191,900 | $0 | $0 |
| 2018 | $2,942 | $186,320 | $0 | $0 |
| 2017 | $2,903 | $180,900 | $0 | $0 |
| 2016 | $2,728 | $175,640 | $0 | $0 |
| 2015 | $2,698 | $178,680 | $0 | $0 |
| 2014 | $2,398 | $166,780 | $0 | $0 |
| 2013 | -- | $154,650 | $0 | $0 |
Source: Public Records
Map
Nearby Homes
- 721 W Oregon Ave
- 635 Wildland Dr
- 707 W Oregon Ave
- 2334 California Ave
- 811 Quail Point Dr
- 820 Quail Park Cir
- 821 Quail Point Dr
- 834 Quail Park Cir
- 720 Buena Vista St
- 636 Front St
- 2530 Berkeley St
- 1227 Front St
- 640 Pelican St
- 332 Front St
- 895 Hanks St
- 0 Lot 13 & 14 California Unit 220201188
- NKA Lakeshore Dr Unit 43
- 239 Nevada St
- 246 Soquel St
- 2150 Kiln St
- 0 Hogue Dr
- 761 Hogue Dr
- 822 Lake Ridge Dr
- 822 Lake Ridge Dr Unit Lot29
- 812 Lake Ridge Dr
- 770 Hogue Dr
- 760 Hogue Dr
- 620 Wildland Dr
- 780 Hogue Dr
- 802 Lake Ridge Dr
- 802 Hogue Dr
- 812 Hogue Dr Dr
- 825 Lake Ridge Dr
- 835 Lake Ridge Dr
- 815 Lake Ridge Dr
- 0 Hill St
- 812 Hogue Dr
- 750 Hogue Dr
- 9 Lakeridge Ct
- 845 Lake Ridge Dr