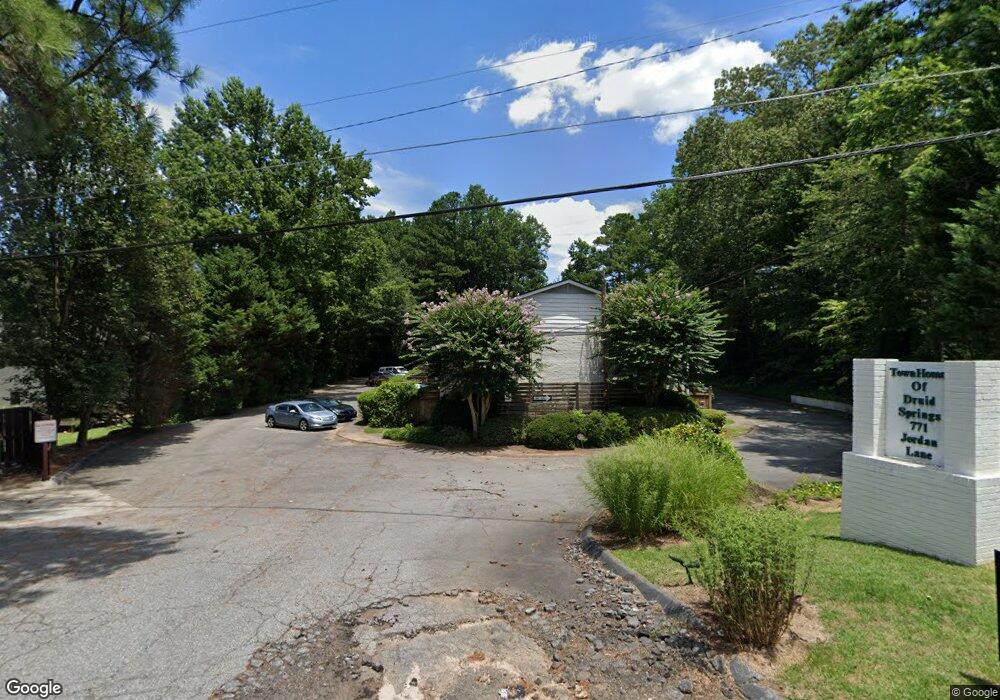
771 Jordan Ln Unit IT Decatur, GA 30033
Greater Valley Brook NeighborhoodEstimated Value: $206,312 - $226,000
2
Beds
2
Baths
960
Sq Ft
$225/Sq Ft
Est. Value
About This Home
This home is located at 771 Jordan Ln Unit IT, Decatur, GA 30033 and is currently estimated at $216,078, approximately $225 per square foot. 771 Jordan Ln Unit IT is a home located in DeKalb County with nearby schools including McLendon Elementary School, Druid Hills Middle School, and Druid Hills High School.
Ownership History
Date
Name
Owned For
Owner Type
Purchase Details
Closed on
Oct 22, 2018
Sold by
Thomas Zachary P
Bought by
Thomas Adrienne M
Current Estimated Value
Home Financials for this Owner
Home Financials are based on the most recent Mortgage that was taken out on this home.
Original Mortgage
$131,100
Outstanding Balance
$113,606
Interest Rate
4.6%
Mortgage Type
New Conventional
Estimated Equity
$102,472
Purchase Details
Closed on
Jun 14, 2017
Sold by
Kelly Ard
Bought by
Thomas Adrienne M and Thomas Zachary P
Home Financials for this Owner
Home Financials are based on the most recent Mortgage that was taken out on this home.
Original Mortgage
$118,340
Interest Rate
4.02%
Mortgage Type
New Conventional
Purchase Details
Closed on
Aug 25, 2005
Sold by
Thomas Towne Homes Inc
Bought by
Ard Kelly
Home Financials for this Owner
Home Financials are based on the most recent Mortgage that was taken out on this home.
Original Mortgage
$105,800
Interest Rate
5.63%
Mortgage Type
New Conventional
Create a Home Valuation Report for This Property
The Home Valuation Report is an in-depth analysis detailing your home's value as well as a comparison with similar homes in the area
Home Values in the Area
Average Home Value in this Area
Purchase History
| Date | Buyer | Sale Price | Title Company |
|---|---|---|---|
| Thomas Adrienne M | -- | -- | |
| Acton Holly M | $138,000 | -- | |
| Thomas Adrienne M | $122,000 | -- | |
| Ard Kelly | $132,400 | -- |
Source: Public Records
Mortgage History
| Date | Status | Borrower | Loan Amount |
|---|---|---|---|
| Open | Acton Holly M | $131,100 | |
| Closed | Thomas Adrienne M | $131,100 | |
| Previous Owner | Thomas Adrienne M | $118,340 | |
| Previous Owner | Ard Kelly | $105,800 |
Source: Public Records
Tax History Compared to Growth
Tax History
| Year | Tax Paid | Tax Assessment Tax Assessment Total Assessment is a certain percentage of the fair market value that is determined by local assessors to be the total taxable value of land and additions on the property. | Land | Improvement |
|---|---|---|---|---|
| 2025 | $2,210 | $91,600 | $20,000 | $71,600 |
| 2024 | $2,243 | $90,160 | $20,000 | $70,160 |
| 2023 | $2,243 | $86,160 | $20,000 | $66,160 |
| 2022 | $1,589 | $61,560 | $7,600 | $53,960 |
| 2021 | $1,438 | $55,000 | $7,600 | $47,400 |
| 2020 | $1,407 | $53,440 | $7,600 | $45,840 |
| 2019 | $1,398 | $53,760 | $7,600 | $46,160 |
| 2018 | $1,150 | $47,720 | $7,600 | $40,120 |
| 2017 | $1,026 | $39,680 | $7,600 | $32,080 |
| 2016 | $979 | $39,240 | $7,600 | $31,640 |
| 2014 | $182 | $15,880 | $7,600 | $8,280 |
Source: Public Records
Map
Nearby Homes
- 2784 Arborcrest Dr
- 2796 Arborcrest Dr
- 813 Jordan Ln Unit 4
- 828 Constellation Dr
- 811 Whelchel Dr
- 2855 Hollywood Dr
- 819 Gardenia Ln
- 835 Alberson Ct
- 2555 Mccurdy Way
- 811 Cinderella Way
- 2956 Hollywood Dr
- 2943 Westbury Dr
- 405 Tuxworth Cir
- 2963 Orion Dr
- 2306 Stratford Commons
- 2965 Judylyn Dr
- 4201 Stratford Commons
- 2103 Stratford Commons
- 321 Tuxworth Cir Unit 321
- 2588 Wood Trail Ln
- 771 Jordan Ln Unit M
- 771 Jordan Ln Unit F
- 771 Jordan Ln Unit L
- 771 Jordan Ln Unit P
- 771 Jordan Ln Unit D
- 771 Jordan Ln Unit A
- 771 Jordan Ln Unit N
- 771 Jordan Ln Unit J
- 771 Jordan Ln Unit B
- 771 Jordan Ln Unit E
- 771 Jordan Ln Unit IT
- 771 Jordan Ln Unit IT
- 771 Jordan Ln Unit IT
- 771 Jordan Ln Unit IT
- 771 Jordan Ln Unit IT
- 771 Jordan Ln Unit IT
- 771 Jordan Ln Unit IT
- 771 Jordan Ln Unit IT
- 771 Jordan Ln Unit IT
- 771 Jordan Ln Unit IT