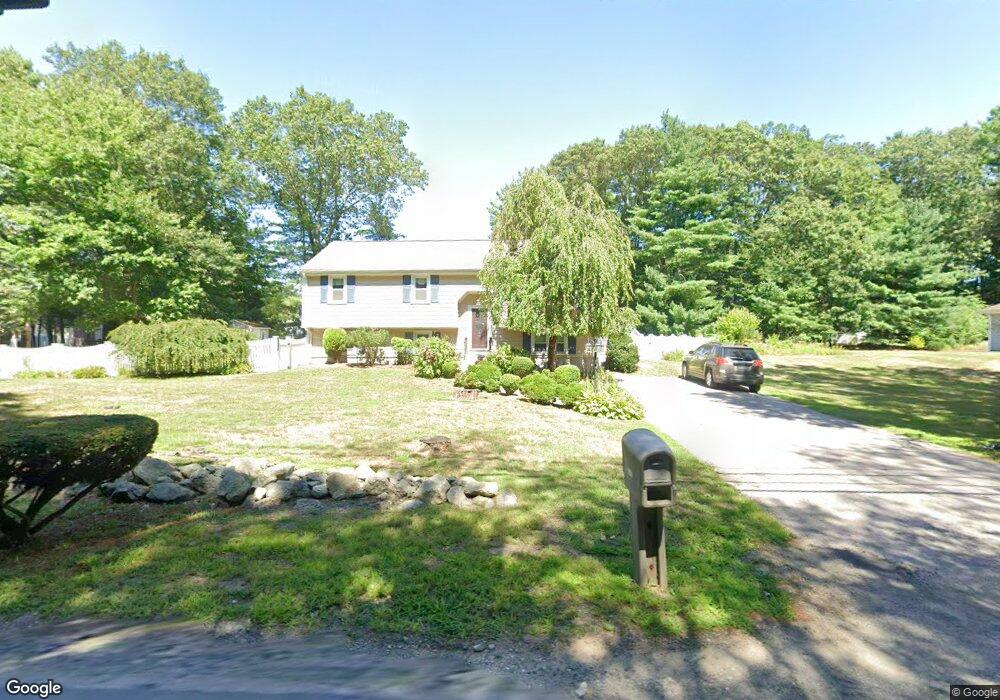
771 Lindsey St Attleboro, MA 02703
Estimated Value: $542,000 - $589,000
3
Beds
2
Baths
1,132
Sq Ft
$501/Sq Ft
Est. Value
About This Home
This home is located at 771 Lindsey St, Attleboro, MA 02703 and is currently estimated at $566,777, approximately $500 per square foot. 771 Lindsey St is a home located in Bristol County with nearby schools including Thomas E. Willett School, Cyril K. Brennan Middle School, and Attleboro High School.
Ownership History
Date
Name
Owned For
Owner Type
Purchase Details
Closed on
Jul 28, 1997
Sold by
Hughes Eric M and Hughes Lorraine M
Bought by
Odonnell Shawn E and Odonnell Christine R
Current Estimated Value
Create a Home Valuation Report for This Property
The Home Valuation Report is an in-depth analysis detailing your home's value as well as a comparison with similar homes in the area
Home Values in the Area
Average Home Value in this Area
Purchase History
| Date | Buyer | Sale Price | Title Company |
|---|---|---|---|
| Odonnell Shawn E | $142,700 | -- |
Source: Public Records
Mortgage History
| Date | Status | Borrower | Loan Amount |
|---|---|---|---|
| Open | Odonnell Shawn E | $111,600 | |
| Closed | Odonnell Shawn E | $112,000 | |
| Closed | Odonnell Shawn E | $138,000 |
Source: Public Records
Tax History Compared to Growth
Tax History
| Year | Tax Paid | Tax Assessment Tax Assessment Total Assessment is a certain percentage of the fair market value that is determined by local assessors to be the total taxable value of land and additions on the property. | Land | Improvement |
|---|---|---|---|---|
| 2025 | $5,636 | $449,100 | $139,400 | $309,700 |
| 2024 | $5,613 | $440,900 | $139,400 | $301,500 |
| 2023 | $5,275 | $385,300 | $126,800 | $258,500 |
| 2022 | $4,985 | $345,000 | $120,700 | $224,300 |
| 2021 | $4,626 | $312,600 | $116,200 | $196,400 |
| 2020 | $4,369 | $300,100 | $113,000 | $187,100 |
| 2019 | $4,126 | $291,400 | $110,800 | $180,600 |
| 2018 | $3,942 | $266,000 | $107,600 | $158,400 |
| 2017 | $3,878 | $266,500 | $107,600 | $158,900 |
| 2016 | $3,669 | $247,600 | $105,500 | $142,100 |
| 2015 | $3,620 | $246,100 | $105,500 | $140,600 |
| 2014 | $3,465 | $233,300 | $100,500 | $132,800 |
Source: Public Records
Map
Nearby Homes