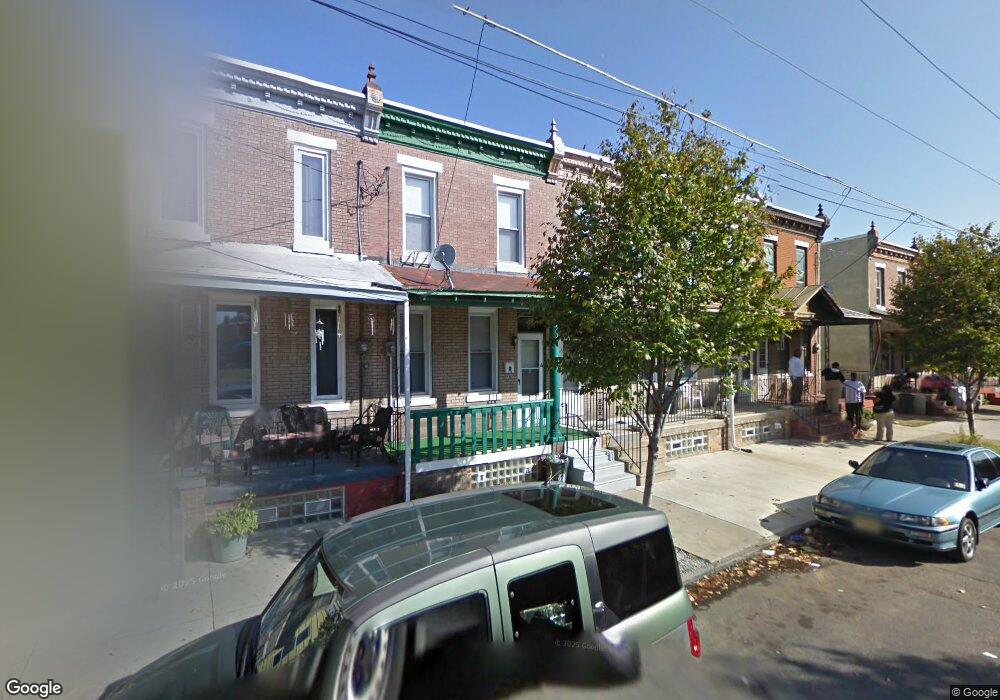
771 Line St Camden, NJ 08103
Lanning Square NeighborhoodEstimated Value: $104,804 - $173,000
--
Bed
--
Bath
1,160
Sq Ft
$130/Sq Ft
Est. Value
About This Home
This home is located at 771 Line St, Camden, NJ 08103 and is currently estimated at $150,451, approximately $129 per square foot. 771 Line St is a home located in Camden County with nearby schools including Camden High School, Hope Community Charter School, and Freedom Prep Charter School.
Ownership History
Date
Name
Owned For
Owner Type
Purchase Details
Closed on
Dec 12, 2008
Sold by
Metropolitan Camden Habitat For Humani
Bought by
Flores Cynthia
Current Estimated Value
Home Financials for this Owner
Home Financials are based on the most recent Mortgage that was taken out on this home.
Original Mortgage
$85,965
Interest Rate
6.08%
Mortgage Type
Unknown
Purchase Details
Closed on
Oct 26, 2002
Sold by
Pinkston Sollie J
Bought by
Metropolitan Camden Habitat
Create a Home Valuation Report for This Property
The Home Valuation Report is an in-depth analysis detailing your home's value as well as a comparison with similar homes in the area
Home Values in the Area
Average Home Value in this Area
Purchase History
| Date | Buyer | Sale Price | Title Company |
|---|---|---|---|
| Flores Cynthia | $88,000 | -- | |
| Metropolitan Camden Habitat | $4,000 | -- |
Source: Public Records
Mortgage History
| Date | Status | Borrower | Loan Amount |
|---|---|---|---|
| Previous Owner | Flores Cynthia | $85,965 |
Source: Public Records
Tax History Compared to Growth
Tax History
| Year | Tax Paid | Tax Assessment Tax Assessment Total Assessment is a certain percentage of the fair market value that is determined by local assessors to be the total taxable value of land and additions on the property. | Land | Improvement |
|---|---|---|---|---|
| 2025 | $2,246 | $63,400 | $6,700 | $56,700 |
| 2024 | $2,171 | $63,400 | $6,700 | $56,700 |
| 2023 | $2,171 | $63,400 | $6,700 | $56,700 |
| 2022 | $2,131 | $63,400 | $6,700 | $56,700 |
| 2021 | $2,123 | $63,400 | $6,700 | $56,700 |
| 2020 | $2,016 | $63,400 | $6,700 | $56,700 |
| 2019 | $1,931 | $63,400 | $6,700 | $56,700 |
| 2018 | $1,920 | $63,400 | $6,700 | $56,700 |
| 2017 | $1,873 | $63,400 | $6,700 | $56,700 |
| 2016 | $1,814 | $63,400 | $6,700 | $56,700 |
| 2015 | $1,746 | $63,400 | $6,700 | $56,700 |
| 2014 | $1,704 | $63,400 | $6,700 | $56,700 |
Source: Public Records
Map
Nearby Homes
- 715 S 8th St
- 746 Pine St
- 803 Princeton Ave
- 637 637 Royden
- 700 New St Unit 308
- 836 S 8th St
- 724 Spruce St
- 718 Spruce St
- 917 S 8th St
- 810 S 6th St
- 1020 Ramona Gonzalez St
- 611 Saint John St
- 764 Mount Vernon St
- 602 S 5th St
- 604 S 5th St
- 513 Benson St
- 1003 Langham Ave
- 608 Sycamore St
- 1036 Princess Ave
- 1046 Haddon Ave