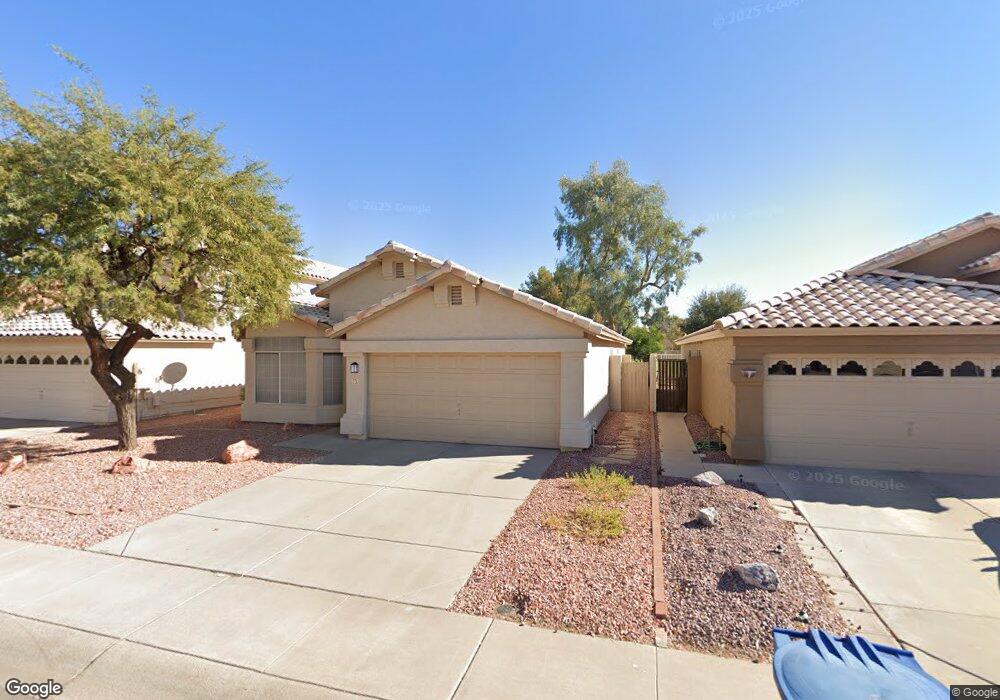
771 N Cholla St Chandler, AZ 85224
Central Ridge NeighborhoodEstimated Value: $416,515 - $524,000
--
Bed
3
Baths
1,646
Sq Ft
$293/Sq Ft
Est. Value
About This Home
This home is located at 771 N Cholla St, Chandler, AZ 85224 and is currently estimated at $482,629, approximately $293 per square foot. 771 N Cholla St is a home located in Maricopa County with nearby schools including Hartford Sylvia Encinas Elementary School, Andersen Junior High School, and Chandler High School.
Ownership History
Date
Name
Owned For
Owner Type
Purchase Details
Closed on
Feb 25, 2014
Sold by
Marsh David N
Bought by
Marsh Stanley Cholla Llc
Current Estimated Value
Purchase Details
Closed on
Jun 2, 2004
Sold by
Pond Lauren and Pond Victoria
Bought by
Marsh David N
Home Financials for this Owner
Home Financials are based on the most recent Mortgage that was taken out on this home.
Original Mortgage
$138,000
Interest Rate
4.62%
Mortgage Type
Purchase Money Mortgage
Purchase Details
Closed on
Mar 28, 2002
Sold by
Pfenning Kevin M
Bought by
Pond Lauren and Pond Victoria
Home Financials for this Owner
Home Financials are based on the most recent Mortgage that was taken out on this home.
Original Mortgage
$141,550
Interest Rate
6.84%
Mortgage Type
New Conventional
Purchase Details
Closed on
Apr 5, 1994
Sold by
Hazzard Theodore B
Bought by
Pfenning Kevin M
Home Financials for this Owner
Home Financials are based on the most recent Mortgage that was taken out on this home.
Original Mortgage
$81,000
Interest Rate
7.79%
Mortgage Type
New Conventional
Create a Home Valuation Report for This Property
The Home Valuation Report is an in-depth analysis detailing your home's value as well as a comparison with similar homes in the area
Home Values in the Area
Average Home Value in this Area
Purchase History
| Date | Buyer | Sale Price | Title Company |
|---|---|---|---|
| Marsh Stanley Cholla Llc | -- | None Available | |
| Marsh David N | $172,500 | Ticor Title Agency Of Az Inc | |
| Pond Lauren | $149,000 | Transnation Title Insurance | |
| Pfenning Kevin M | $104,000 | United Title Agency |
Source: Public Records
Mortgage History
| Date | Status | Borrower | Loan Amount |
|---|---|---|---|
| Previous Owner | Marsh David N | $138,000 | |
| Previous Owner | Pond Lauren | $141,550 | |
| Previous Owner | Pfenning Kevin M | $81,000 | |
| Closed | Marsh David N | $25,875 |
Source: Public Records
Tax History Compared to Growth
Tax History
| Year | Tax Paid | Tax Assessment Tax Assessment Total Assessment is a certain percentage of the fair market value that is determined by local assessors to be the total taxable value of land and additions on the property. | Land | Improvement |
|---|---|---|---|---|
| 2025 | $2,199 | $23,517 | -- | -- |
| 2024 | $2,122 | $22,398 | -- | -- |
| 2023 | $2,122 | $34,810 | $6,960 | $27,850 |
| 2022 | $2,055 | $25,570 | $5,110 | $20,460 |
| 2021 | $2,113 | $24,350 | $4,870 | $19,480 |
| 2020 | $2,101 | $23,160 | $4,630 | $18,530 |
| 2019 | $2,027 | $21,960 | $4,390 | $17,570 |
| 2018 | $1,969 | $20,270 | $4,050 | $16,220 |
| 2017 | $1,850 | $19,080 | $3,810 | $15,270 |
| 2016 | $1,787 | $18,620 | $3,720 | $14,900 |
| 2015 | $1,714 | $17,580 | $3,510 | $14,070 |
Source: Public Records
Map
Nearby Homes
- 1530 W Ivanhoe Ct
- 765 N Arrowhead Dr
- 1592 W Shannon Ct
- 590 N Cholla St
- 1825 W Ray Rd Unit 2036
- 1825 W Ray Rd Unit 1068
- 1825 W Ray Rd Unit 1008
- 1825 W Ray Rd Unit 1063
- 1825 W Ray Rd Unit 1054
- 1825 W Ray Rd Unit 2070
- 1825 W Ray Rd Unit 2044
- 1825 W Ray Rd Unit 1083
- 1825 W Ray Rd Unit 2082
- 1825 W Ray Rd Unit 2052
- 1601 W Oakland St
- 700 N Dobson Rd Unit 11
- 700 N Dobson Rd Unit 16
- 1233 W Dublin St
- 1640 W Gail Dr
- 333 N Pennington Dr Unit 15
- 777 N Cholla St
- 765 N Cholla St
- 783 N Cholla St
- 759 N Cholla St
- 1700 W Ivanhoe St
- 789 N Cholla St
- 753 N Cholla St
- 800 N Cholla St
- 747 N Cholla St
- 1720 W Ivanhoe St
- 795 N Cholla St
- 1701 W Ivanhoe St
- 812 N Cholla St
- 1711 W Ivanhoe St
- 801 N Cholla St
- 1740 W Ivanhoe St
- 1721 W Ivanhoe St
- 807 N Cholla St
- 818 N Cholla St
- 735 N Cholla St