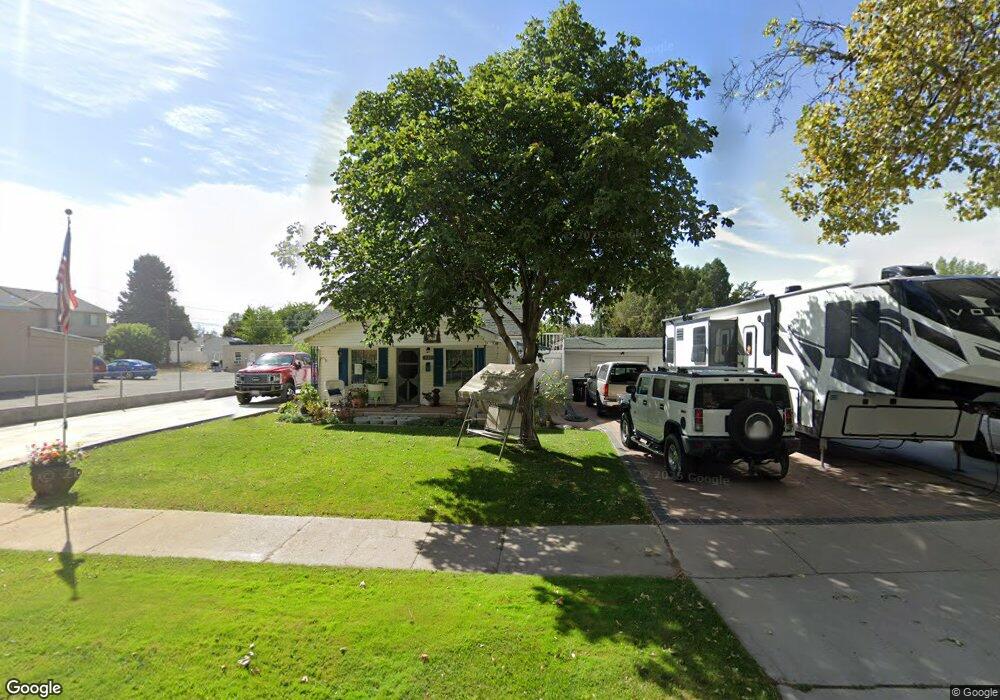
771 N Main St Brigham City, UT 84302
Estimated Value: $339,000 - $447,000
4
Beds
3
Baths
1,574
Sq Ft
$242/Sq Ft
Est. Value
About This Home
This home is located at 771 N Main St, Brigham City, UT 84302 and is currently estimated at $380,779, approximately $241 per square foot. 771 N Main St is a home located in Box Elder County with nearby schools including Discovery School, Box Elder Middle School, and Adele C. Young Intermediate School.
Ownership History
Date
Name
Owned For
Owner Type
Purchase Details
Closed on
Nov 20, 2019
Sold by
Vreeland Real Estate Llc
Bought by
Mcguire Joseph
Current Estimated Value
Home Financials for this Owner
Home Financials are based on the most recent Mortgage that was taken out on this home.
Original Mortgage
$223,281
Outstanding Balance
$197,013
Interest Rate
3.75%
Mortgage Type
FHA
Estimated Equity
$183,766
Purchase Details
Closed on
Jul 8, 2019
Sold by
Utah Rei Inc
Bought by
Vreeland Real Estate Llc
Home Financials for this Owner
Home Financials are based on the most recent Mortgage that was taken out on this home.
Original Mortgage
$112,200
Interest Rate
3.9%
Mortgage Type
Commercial
Purchase Details
Closed on
Sep 9, 2011
Sold by
Phoeniz Restoration Llc
Bought by
Utah Rei Inc
Purchase Details
Closed on
Oct 23, 2006
Sold by
Nebeker Kyle
Bought by
Nebeker Kyle and Nebeker Brandy
Create a Home Valuation Report for This Property
The Home Valuation Report is an in-depth analysis detailing your home's value as well as a comparison with similar homes in the area
Home Values in the Area
Average Home Value in this Area
Purchase History
| Date | Buyer | Sale Price | Title Company |
|---|---|---|---|
| Mcguire Joseph | -- | Real Advantage Ttl Ins Agcy | |
| Vreeland Real Estate Llc | -- | Title Services | |
| Utah Rei Inc | -- | American Preferred Title | |
| Nebeker Kyle | -- | American Secure Title |
Source: Public Records
Mortgage History
| Date | Status | Borrower | Loan Amount |
|---|---|---|---|
| Open | Mcguire Joseph | $223,281 | |
| Previous Owner | Vreeland Real Estate Llc | $112,200 |
Source: Public Records
Tax History Compared to Growth
Tax History
| Year | Tax Paid | Tax Assessment Tax Assessment Total Assessment is a certain percentage of the fair market value that is determined by local assessors to be the total taxable value of land and additions on the property. | Land | Improvement |
|---|---|---|---|---|
| 2025 | $1,577 | $311,184 | $105,000 | $206,184 |
| 2024 | $1,577 | $303,541 | $100,000 | $203,541 |
| 2023 | $1,637 | $322,652 | $95,000 | $227,652 |
| 2022 | $1,293 | $130,329 | $22,000 | $108,329 |
| 2021 | $1,173 | $170,695 | $40,000 | $130,695 |
| 2020 | $1,051 | $170,695 | $40,000 | $130,695 |
| 2019 | $990 | $85,612 | $22,000 | $63,612 |
| 2018 | $899 | $77,315 | $22,000 | $55,315 |
| 2017 | $879 | $130,804 | $16,500 | $100,804 |
| 2016 | $921 | $69,302 | $16,500 | $52,802 |
| 2015 | $858 | $64,502 | $16,500 | $48,002 |
| 2014 | $858 | $62,216 | $16,500 | $45,716 |
| 2013 | -- | $62,216 | $16,500 | $45,716 |
Source: Public Records
Map
Nearby Homes
- 760 N Main St
- 613 N 100 E
- 262 W 800 N
- 1422 N 250 W Unit 59
- 81 W 925 N
- Saddlewood Plan at North Point - Brigham City
- Westminster Plan at North Point - Brigham City
- Sitka Plan at North Point - Brigham City (Townhomes)
- Stonebrook Plan at North Point - Brigham City
- Greystone Plan at North Point - Brigham City
- Madison Plan at North Point - Brigham City
- 93 W 925 N
- 335 W 950 N Unit 9
- 96 W 950 N Unit 2
- 621 N 300 E
- 221 W 925 N Unit H46
- 130 W 950 N Unit 4
- 190 W 925 N Unit M70
- 243 W 925 N Unit I48
- 247 W 925 N Unit I49
- 773 N Main St
- 759 N Main St
- 776 N 100 W
- 749 N Main St
- 756 N 100 W
- 790 N 100 W
- 775 N Main St
- 735 N Main St
- 820 N 100 W
- 810 N Main St
- 810 N Main St Unit 102
- 810 N Main St Unit 101
- 810 N Main St Unit 104
- 810 N Main St Unit 103
- 810 N Main St
- 810 N Main St
- 810 N Main St Unit 105
- 810 N Main St Unit 106
- 802 N Main St
- 740 N Main St