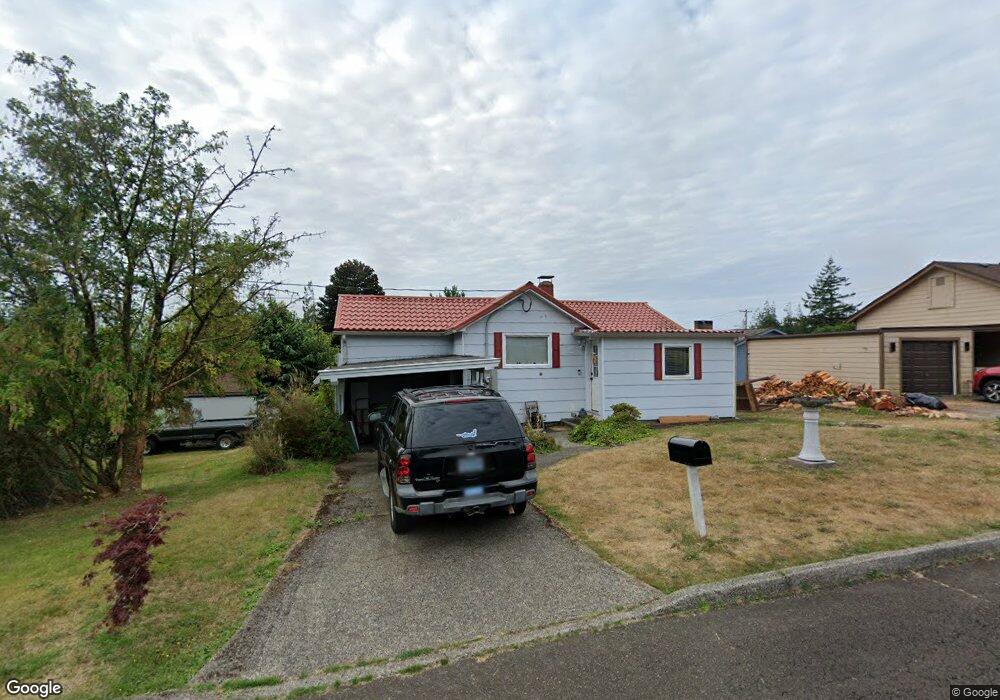
771 Nehalem Ave Astoria, OR 97103
Estimated Value: $313,000 - $350,636
1
Bed
1
Bath
770
Sq Ft
$431/Sq Ft
Est. Value
About This Home
This home is located at 771 Nehalem Ave, Astoria, OR 97103 and is currently estimated at $331,909, approximately $431 per square foot. 771 Nehalem Ave is a home located in Clatsop County with nearby schools including Lewis & Clark Elementary School, Astor Elementary School, and Astoria Middle School.
Ownership History
Date
Name
Owned For
Owner Type
Purchase Details
Closed on
Aug 27, 2015
Sold by
Utzinger Cassandra
Bought by
Brown Hamil E
Current Estimated Value
Home Financials for this Owner
Home Financials are based on the most recent Mortgage that was taken out on this home.
Original Mortgage
$109,693
Outstanding Balance
$86,096
Interest Rate
4.05%
Mortgage Type
New Conventional
Estimated Equity
$245,813
Purchase Details
Closed on
Feb 24, 1995
Sold by
Kiminki Hedy M
Bought by
Utzinger Grover W and Utzinger Fran
Create a Home Valuation Report for This Property
The Home Valuation Report is an in-depth analysis detailing your home's value as well as a comparison with similar homes in the area
Home Values in the Area
Average Home Value in this Area
Purchase History
| Date | Buyer | Sale Price | Title Company |
|---|---|---|---|
| Brown Hamil E | $107,500 | Ticor Title Ins Co | |
| Utzinger Grover W | $40,500 | None Available |
Source: Public Records
Mortgage History
| Date | Status | Borrower | Loan Amount |
|---|---|---|---|
| Open | Brown Hamil E | $109,693 |
Source: Public Records
Tax History Compared to Growth
Tax History
| Year | Tax Paid | Tax Assessment Tax Assessment Total Assessment is a certain percentage of the fair market value that is determined by local assessors to be the total taxable value of land and additions on the property. | Land | Improvement |
|---|---|---|---|---|
| 2025 | $2,169 | $108,603 | -- | -- |
| 2024 | $2,110 | $105,440 | -- | -- |
| 2023 | $2,038 | $102,370 | $0 | $0 |
| 2022 | $1,926 | $99,390 | $0 | $0 |
| 2021 | $1,873 | $96,496 | $0 | $0 |
| 2020 | $1,820 | $93,686 | $0 | $0 |
| 2019 | $1,766 | $90,959 | $0 | $0 |
| 2018 | $1,624 | $88,311 | $0 | $0 |
| 2017 | $1,157 | $63,761 | $0 | $0 |
| 2016 | $1,106 | $61,905 | $30,872 | $31,033 |
| 2015 | $1,084 | $60,103 | $29,973 | $30,130 |
| 2014 | $1,064 | $58,353 | $0 | $0 |
| 2013 | -- | $56,654 | $0 | $0 |
Source: Public Records
Map
Nearby Homes
- 1858 5th St
- 0 Oregon 202
- V/L Oregon 202
- 375 Mcclure Ave
- 1362 Olney Ave
- 285 Waldorf Place
- 1389 Miller Ln
- 1175 11th St
- 1320 15th St
- 8th St. Irving St
- 1215 15th St
- 25 W Kensington Ave
- 325 W Niagara Ave
- 160 W Lexington Ave
- 23 Skyline Ave
- 674 11th St
- 640 8th St Unit 644
- 811 Franklin Ave Unit 813
- 0 W Marine Dr
- 0 Wireless Rd