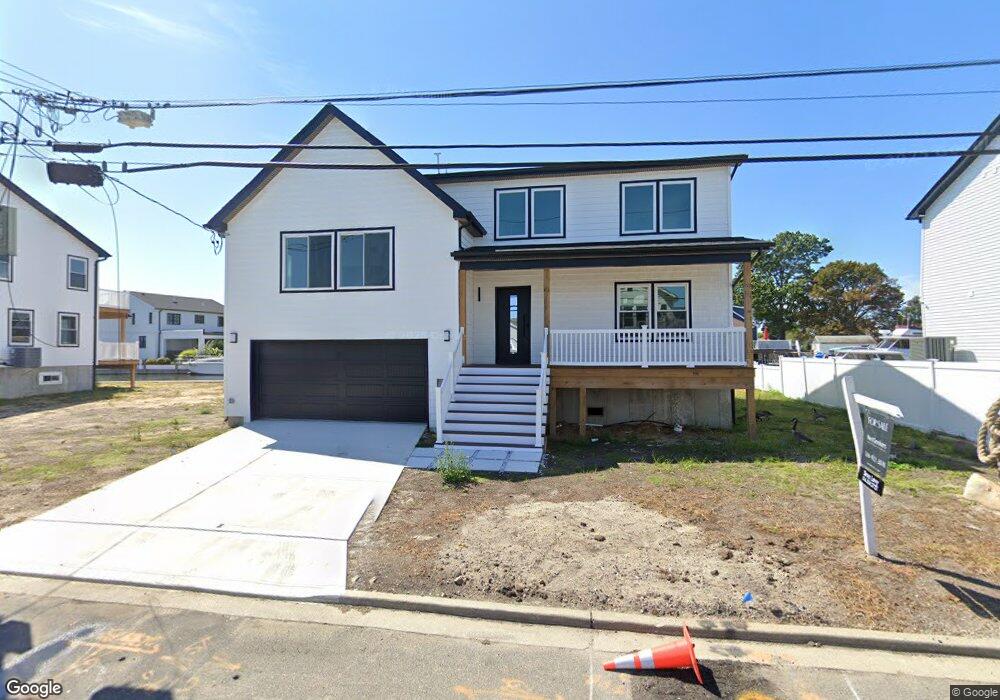
771 S 9th St Unit A Lindenhurst, NY 11757
Estimated Value: $822,000 - $915,635
5
Beds
6
Baths
1,660
Sq Ft
$526/Sq Ft
Est. Value
About This Home
This home is located at 771 S 9th St Unit A, Lindenhurst, NY 11757 and is currently estimated at $872,409, approximately $525 per square foot. 771 S 9th St Unit A is a home located in Suffolk County with nearby schools including Lindenhurst Middle School and Lindenhurst Senior High School.
Ownership History
Date
Name
Owned For
Owner Type
Purchase Details
Closed on
Oct 11, 2019
Sold by
Fnma
Bought by
All Nations Associates
Current Estimated Value
Purchase Details
Closed on
Feb 22, 2016
Sold by
Referee Of Suffolk County and England
Bought by
Federal National Mortgage Association
Purchase Details
Closed on
Feb 24, 2010
Sold by
Miller Samantha Ann and Prest Joseph Harold
Bought by
Miller Samantha Ann
Create a Home Valuation Report for This Property
The Home Valuation Report is an in-depth analysis detailing your home's value as well as a comparison with similar homes in the area
Home Values in the Area
Average Home Value in this Area
Purchase History
| Date | Buyer | Sale Price | Title Company |
|---|---|---|---|
| All Nations Associates | $147,000 | -- | |
| Federal National Mortgage Association | $245,241 | None Available | |
| Miller Samantha Ann | -- | -- |
Source: Public Records
Mortgage History
| Date | Status | Borrower | Loan Amount |
|---|---|---|---|
| Closed | Federal National Mortgage Association | $0 |
Source: Public Records
Tax History Compared to Growth
Tax History
| Year | Tax Paid | Tax Assessment Tax Assessment Total Assessment is a certain percentage of the fair market value that is determined by local assessors to be the total taxable value of land and additions on the property. | Land | Improvement |
|---|---|---|---|---|
| 2024 | $11,618 | $5,660 | $1,370 | $4,290 |
| 2023 | $10,691 | $3,190 | $750 | $2,440 |
| 2022 | $9,596 | $740 | $740 | $0 |
| 2021 | $9,596 | $740 | $740 | $0 |
| 2020 | $9,603 | $3,030 | $740 | $2,290 |
| 2019 | $11,089 | $0 | $0 | $0 |
| 2018 | -- | $3,030 | $740 | $2,290 |
| 2017 | $9,576 | $3,030 | $740 | $2,290 |
| 2016 | $10,331 | $3,030 | $740 | $2,290 |
| 2015 | -- | $3,030 | $740 | $2,290 |
| 2014 | -- | $3,030 | $740 | $2,290 |
Source: Public Records
Map
Nearby Homes