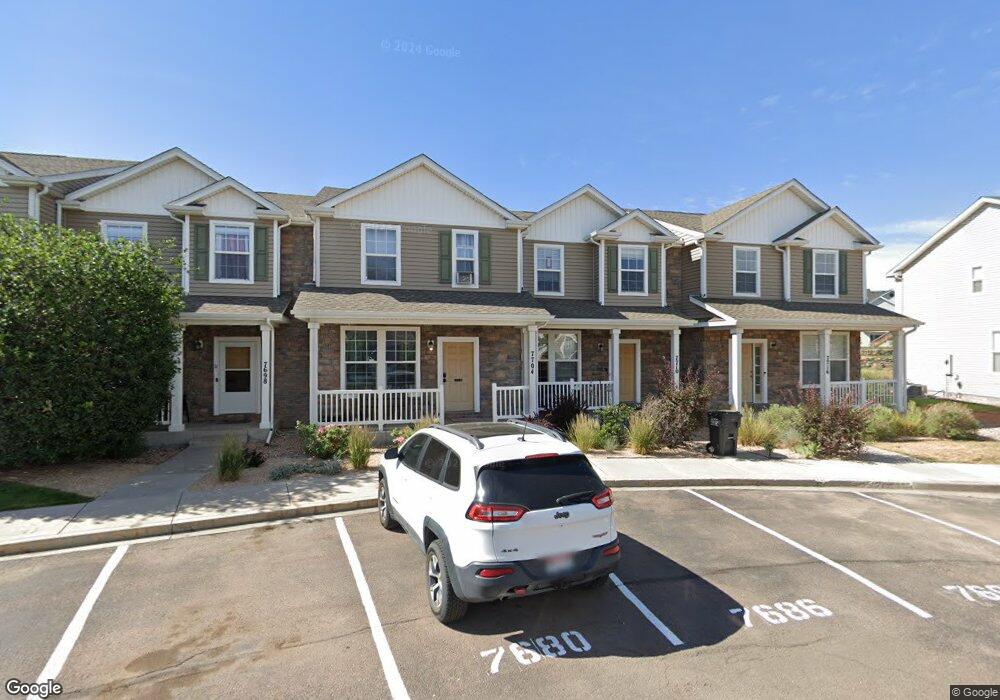
7710 Sandy Springs Point Fountain, CO 80817
North Fountain Valley NeighborhoodEstimated Value: $278,228 - $302,000
2
Beds
3
Baths
1,306
Sq Ft
$224/Sq Ft
Est. Value
About This Home
This home is located at 7710 Sandy Springs Point, Fountain, CO 80817 and is currently estimated at $292,057, approximately $223 per square foot. 7710 Sandy Springs Point is a home located in El Paso County with nearby schools including Webster Elementary School, Janitell Junior High School, and Mesa Ridge High School.
Ownership History
Date
Name
Owned For
Owner Type
Purchase Details
Closed on
Sep 1, 2021
Sold by
Pope Angela M
Bought by
Hp Colorado I Llc
Current Estimated Value
Purchase Details
Closed on
Jun 11, 2021
Sold by
Pope Timothy L
Bought by
Pope Angela M
Purchase Details
Closed on
Jul 27, 2017
Sold by
Berve Christopher R
Bought by
Pope Timothy L and Pope Angela M
Home Financials for this Owner
Home Financials are based on the most recent Mortgage that was taken out on this home.
Original Mortgage
$132,000
Interest Rate
3.91%
Mortgage Type
New Conventional
Purchase Details
Closed on
Jun 8, 2005
Sold by
Pulte Home Corp
Bought by
Berve Christopher R
Home Financials for this Owner
Home Financials are based on the most recent Mortgage that was taken out on this home.
Original Mortgage
$133,492
Interest Rate
5.79%
Mortgage Type
FHA
Create a Home Valuation Report for This Property
The Home Valuation Report is an in-depth analysis detailing your home's value as well as a comparison with similar homes in the area
Home Values in the Area
Average Home Value in this Area
Purchase History
| Date | Buyer | Sale Price | Title Company |
|---|---|---|---|
| Hp Colorado I Llc | $292,000 | Realtech Title Llc | |
| Pope Angela M | -- | None Available | |
| Pope Timothy L | $165,000 | United Title Agencies I Inc | |
| Berve Christopher R | $135,588 | Land Title |
Source: Public Records
Mortgage History
| Date | Status | Borrower | Loan Amount |
|---|---|---|---|
| Previous Owner | Pope Timothy L | $132,000 | |
| Previous Owner | Berve Christopher R | $133,492 | |
| Closed | Berve Christopher R | $4,004 |
Source: Public Records
Tax History Compared to Growth
Tax History
| Year | Tax Paid | Tax Assessment Tax Assessment Total Assessment is a certain percentage of the fair market value that is determined by local assessors to be the total taxable value of land and additions on the property. | Land | Improvement |
|---|---|---|---|---|
| 2025 | $1,444 | $19,660 | -- | -- |
| 2024 | $1,328 | $20,380 | $4,490 | $15,890 |
| 2022 | $1,234 | $14,080 | $2,470 | $11,610 |
| 2021 | $1,227 | $14,480 | $2,540 | $11,940 |
| 2020 | $1,118 | $11,990 | $2,040 | $9,950 |
| 2019 | $1,109 | $11,990 | $2,040 | $9,950 |
| 2018 | $919 | $9,370 | $1,660 | $7,710 |
| 2017 | $924 | $9,370 | $1,660 | $7,710 |
| 2016 | $717 | $8,770 | $1,670 | $7,100 |
| 2015 | $731 | $8,770 | $1,670 | $7,100 |
| 2014 | $708 | $8,550 | $1,590 | $6,960 |
Source: Public Records
Map
Nearby Homes
- 8170 Snow Bowl Heights
- 7554 Sandy Springs Point
- 7536 Sandy Springs Point
- 7524 Sandy Springs Point
- 7601 Duck Hawk Place
- 7455 Dobbs Dr
- 7950 Calamint Ct
- 7287 Creekfront Dr
- 7973 Pinfeather Dr
- 7934 Morton Dr
- 7950 Wythe Dr
- 7826 Stockton Dr
- 7202 Creekfront Dr
- 7904 Morton Dr
- 7866 Stockton Dr
- 7275 Bentwater Dr
- 7776 Braxton Dr
- 1153 Cailin Way
- 7275 Josh Byers Way
- 7307 Glenburn Dr
- 7716 Sandy Springs Point
- 7704 Sandy Springs Point
- 7698 Sandy Springs Point
- 7722 Sandy Springs Point
- 7692 Sandy Springs Point
- 7728 Sandy Springs Point
- 7681 Sandy Springs Point
- 7734 Sandy Springs Point
- 7686 Sandy Springs Point
- 7740 Sandy Springs Point
- 7675 Sandy Springs Point
- 7680 Sandy Springs Point
- 8191 Snow Bowl Heights
- 7674 Sandy Springs Point
- 7669 Sandy Springs Point
- 7752 Sandy Springs Point
- 7668 Sandy Springs Point
- 7663 Sandy Springs Point
- 8181 Snow Bowl Heights
- 7662 Sandy Springs Point