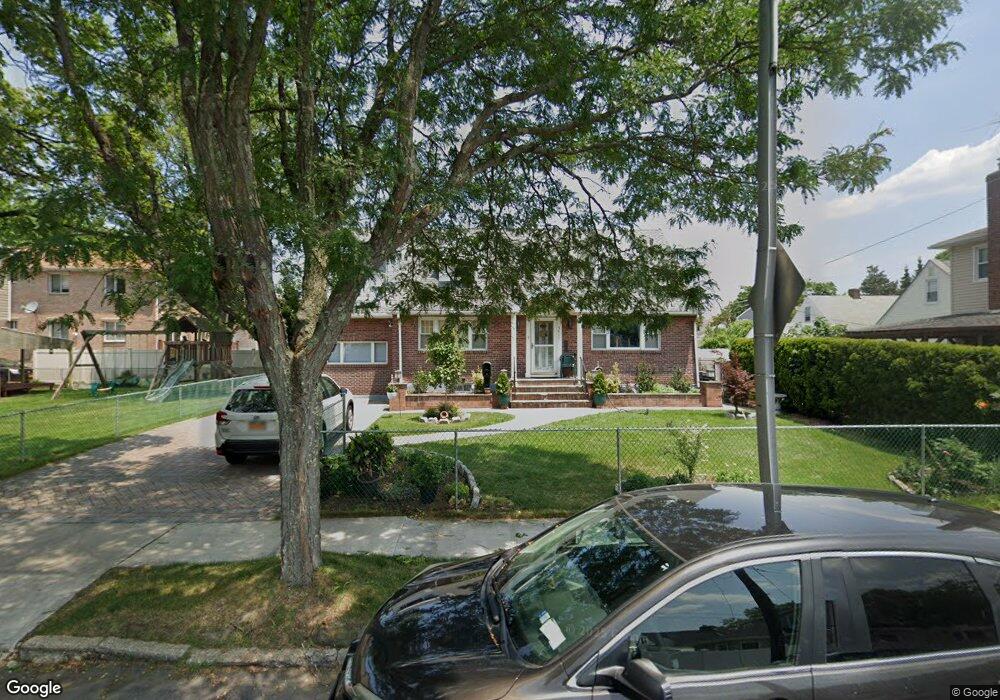
7711 268th St New Hyde Park, NY 11040
Glen Oaks NeighborhoodEstimated Value: $1,070,000 - $1,391,000
--
Bed
--
Bath
1,871
Sq Ft
$633/Sq Ft
Est. Value
About This Home
This home is located at 7711 268th St, New Hyde Park, NY 11040 and is currently estimated at $1,183,436, approximately $632 per square foot. 7711 268th St is a home located in Queens County with nearby schools including P.S.115Q James J Ambrose School, Irwin Altman Middle School 172, and Martin Van Buren High School.
Ownership History
Date
Name
Owned For
Owner Type
Purchase Details
Closed on
Sep 28, 2018
Sold by
Kubal Gangaram
Bought by
Bandlamudi Anuradha and Bandlamudi Kishore
Current Estimated Value
Home Financials for this Owner
Home Financials are based on the most recent Mortgage that was taken out on this home.
Original Mortgage
$300,000
Outstanding Balance
$261,618
Interest Rate
4.5%
Mortgage Type
Purchase Money Mortgage
Estimated Equity
$921,818
Purchase Details
Closed on
Oct 28, 2010
Sold by
Albarracin Cesar and Diliberto Shirley A
Bought by
Kubal Gangaram
Home Financials for this Owner
Home Financials are based on the most recent Mortgage that was taken out on this home.
Original Mortgage
$417,000
Interest Rate
4.41%
Mortgage Type
Purchase Money Mortgage
Purchase Details
Closed on
Jul 3, 1996
Sold by
Addady Arye
Bought by
Figueroa Shirley A and Albarracin Cesar
Home Financials for this Owner
Home Financials are based on the most recent Mortgage that was taken out on this home.
Original Mortgage
$135,000
Interest Rate
8.08%
Create a Home Valuation Report for This Property
The Home Valuation Report is an in-depth analysis detailing your home's value as well as a comparison with similar homes in the area
Home Values in the Area
Average Home Value in this Area
Purchase History
| Date | Buyer | Sale Price | Title Company |
|---|---|---|---|
| Bandlamudi Anuradha | $900,000 | -- | |
| Kubal Gangaram | $611,000 | -- | |
| Figueroa Shirley A | $250,000 | -- |
Source: Public Records
Mortgage History
| Date | Status | Borrower | Loan Amount |
|---|---|---|---|
| Open | Bandlamudi Anuradha | $300,000 | |
| Previous Owner | Kubal Gangaram | $417,000 | |
| Previous Owner | Figueroa Shirley A | $135,000 |
Source: Public Records
Tax History Compared to Growth
Tax History
| Year | Tax Paid | Tax Assessment Tax Assessment Total Assessment is a certain percentage of the fair market value that is determined by local assessors to be the total taxable value of land and additions on the property. | Land | Improvement |
|---|---|---|---|---|
| 2025 | $10,172 | $53,683 | $19,234 | $34,449 |
| 2024 | $10,172 | $50,645 | $17,047 | $33,598 |
| 2023 | $9,596 | $47,779 | $16,942 | $30,837 |
| 2022 | $9,538 | $63,660 | $22,680 | $40,980 |
| 2021 | $9,819 | $56,820 | $22,680 | $34,140 |
| 2020 | $9,469 | $58,860 | $22,680 | $36,180 |
| 2019 | $8,829 | $63,600 | $22,680 | $40,920 |
| 2018 | $8,116 | $39,816 | $18,265 | $21,551 |
| 2017 | $8,116 | $39,816 | $22,396 | $17,420 |
| 2016 | $7,773 | $39,816 | $22,396 | $17,420 |
| 2015 | $4,653 | $37,280 | $23,581 | $13,699 |
| 2014 | $4,653 | $35,170 | $23,116 | $12,054 |
Source: Public Records
Map
Nearby Homes
- 78-30 270th St
- 78-07 264th St
- 7787 Langdale St
- 7927 270th St
- 260-73 75th Ave Unit 1st Fl
- 263-55 74th Ave Unit A-2
- 8019 266th St
- 73-20 263rd St Unit G
- 264-65 Langston Ave Unit GV133E10-2
- 80-59 268th St
- 264-14 Langston Ave Unit A-2
- 264-17 Langston Ave Unit E-2
- 80-64 266th St
- 80-43 263rd St
- 264-31 Langston Ave Unit 2nd Fl.
- 80-18 261st St
- 81-09 Langdale St Unit 217A
- 25 Campbell St
- 23 Flower Ln
- 255-31 75th Ave Unit 2nd Floor
- 26803 Union Turnpike
- 7705 268th St
- 268-08 Union Turnpike
- 26810 77th Ave
- 26807 Union Turnpike
- 7712 269th St
- 26814 77th Ave
- 7716 269th St
- 77-11 268th St
- 26719 Union Turnpike
- 26811 Union Turnpike
- 26719 Union Turnpike
- 7706 269th St
- 267-18 77th Ave
- 26718 77th Ave
- 26819 Union Turnpike
- 26715 Union Turnpike
- 26819 Union Turnpike
- 26714 77th Ave
- 77-6 269th St