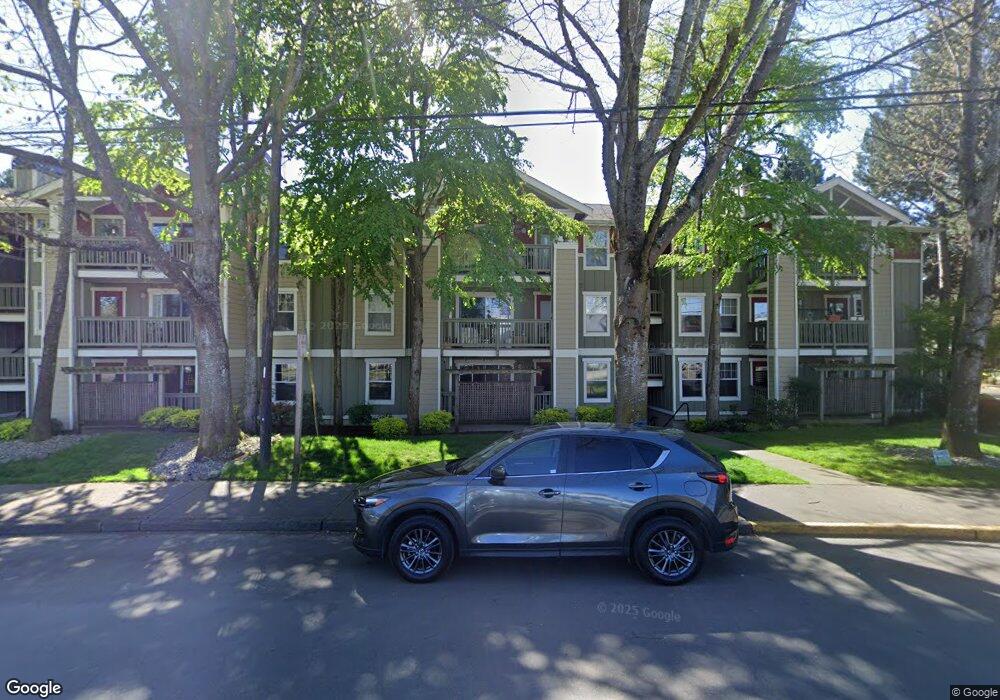
7711 NE 175th St Unit D105 Kenmore, WA 98028
Downtown Kenmore NeighborhoodEstimated Value: $455,000 - $510,000
2
Beds
2
Baths
1,079
Sq Ft
$442/Sq Ft
Est. Value
About This Home
This home is located at 7711 NE 175th St Unit D105, Kenmore, WA 98028 and is currently estimated at $476,403, approximately $441 per square foot. 7711 NE 175th St Unit D105 is a home located in King County with nearby schools including Arrowhead Elementary School, Northshore Junior High School, and Inglemoor High School.
Ownership History
Date
Name
Owned For
Owner Type
Purchase Details
Closed on
Jun 12, 2008
Sold by
Trail Walk Llc
Bought by
Delaney Jacqueline A and Delaney Paul M
Current Estimated Value
Home Financials for this Owner
Home Financials are based on the most recent Mortgage that was taken out on this home.
Original Mortgage
$247,515
Outstanding Balance
$158,342
Interest Rate
5.99%
Mortgage Type
Purchase Money Mortgage
Estimated Equity
$318,061
Purchase Details
Closed on
Jul 23, 1996
Sold by
Steinbach Altheda M and Miller Altheda M
Bought by
Steinbach Altheda M and Steinbach Revocable Living Trust
Purchase Details
Closed on
Nov 18, 1994
Sold by
First National Bank Of Enumclaw
Bought by
Kruse Don and Kruse Betty
Purchase Details
Closed on
Aug 31, 1994
Sold by
J H Baxter & Co Inc
Bought by
J H Baxter & Co
Purchase Details
Closed on
Jun 14, 1994
Sold by
Arntz Neil J and Arntz Marian
Bought by
Arntz Corey M and Arntz Lisa
Purchase Details
Closed on
Nov 15, 1993
Sold by
Day Sherman C
Bought by
Day Verna E
Create a Home Valuation Report for This Property
The Home Valuation Report is an in-depth analysis detailing your home's value as well as a comparison with similar homes in the area
Home Values in the Area
Average Home Value in this Area
Purchase History
| Date | Buyer | Sale Price | Title Company |
|---|---|---|---|
| Delaney Jacqueline A | $251,400 | Commonwealth L | |
| Steinbach Altheda M | -- | -- | |
| Kruse Don | -- | Stewart Title Company | |
| J H Baxter & Co | -- | -- | |
| Arntz Corey M | -- | -- | |
| Day Verna E | -- | Chicago Title Insurance Co |
Source: Public Records
Mortgage History
| Date | Status | Borrower | Loan Amount |
|---|---|---|---|
| Open | Delaney Jacqueline A | $247,515 |
Source: Public Records
Tax History Compared to Growth
Tax History
| Year | Tax Paid | Tax Assessment Tax Assessment Total Assessment is a certain percentage of the fair market value that is determined by local assessors to be the total taxable value of land and additions on the property. | Land | Improvement |
|---|---|---|---|---|
| 2024 | $4,101 | $408,000 | $33,500 | $374,500 |
| 2023 | $3,266 | $441,000 | $39,400 | $401,600 |
| 2022 | $3,491 | $359,000 | $39,500 | $319,500 |
| 2021 | $3,668 | $316,000 | $35,900 | $280,100 |
| 2020 | $3,806 | $306,000 | $35,900 | $270,100 |
| 2018 | $3,250 | $319,000 | $33,500 | $285,500 |
| 2017 | $2,765 | $266,000 | $33,500 | $232,500 |
| 2016 | $2,487 | $228,000 | $31,100 | $196,900 |
| 2015 | $2,366 | $203,000 | $28,700 | $174,300 |
| 2014 | -- | $185,000 | $29,300 | $155,700 |
| 2013 | -- | $134,000 | $27,500 | $106,500 |
Source: Public Records
Map
Nearby Homes
- 7711 NE 175th St Unit F307
- 7711 NE 175th St Unit C106
- 8 Plan at Burke 38
- 7 Plan at Burke 38
- 6 Plan at Burke 38
- 5 Plan at Burke 38
- 4 Plan at Burke 38
- 3 Plan at Burke 38
- 2 Plan at Burke 38
- 1 Plan at Burke 38
- 7301 NE 175th St Unit 331
- 7301 NE 175th St Unit 335
- 7301 NE 175th St
- 7301 NE 175th St Unit 137
- 7301 NE 175th St Unit 114
- 7301 NE 175th St Unit 215
- 7301 NE 175th St Unit 209
- 7614 NE Bothell Way Unit 11
- 7634 NE 170th St
- 7223 NE 175th St Unit 108
- 7711 NE 175th St Unit 308B
- 7711 NE 175th St Unit 103 A
- 7711 NE 175th St
- 7711 NE 175th St Unit D101
- 7711 NE 175th St Unit C102
- 7711 NE 175th St Unit E102
- 7711 NE 175th St Unit F103
- 7711 NE 175th St Unit C207
- 7711 NE 175th St Unit C101
- 7711 NE 175th St Unit B107
- 7711 NE 175th St Unit C203
- 7711 NE 175th St Unit B103
- 7711 NE 175th St Unit C107
- 7711 NE 175th St Unit D102
- 7711 NE 175th St Unit D207
- 7711 NE 175th St Unit F203
- 7711 NE 175th St Unit E306
- 7711 NE 175th St Unit A102
- 7711 NE 175th St Unit E302
- 7711 NE 175th St Unit F106