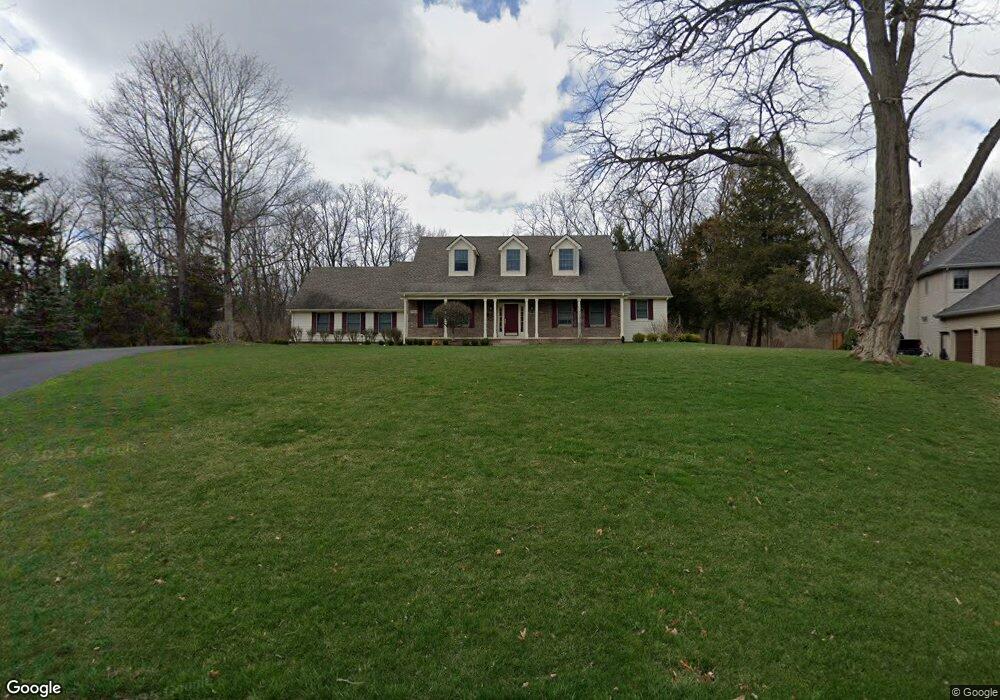
7713 Hunters Point Unit 43 Brighton, MI 48116
Estimated Value: $602,000 - $728,000
4
Beds
3
Baths
2,580
Sq Ft
$251/Sq Ft
Est. Value
About This Home
This home is located at 7713 Hunters Point Unit 43, Brighton, MI 48116 and is currently estimated at $647,939, approximately $251 per square foot. 7713 Hunters Point Unit 43 is a home located in Livingston County with nearby schools including Hawkins Elementary School, Scranton Middle School, and Brighton High School.
Ownership History
Date
Name
Owned For
Owner Type
Purchase Details
Closed on
Jan 5, 2023
Sold by
Mcgehee Christopher
Bought by
Mcgehee Christopher K and Mcgehee Joanne C
Current Estimated Value
Purchase Details
Closed on
Nov 25, 2020
Sold by
Gulledge Diane V and The Terry E Gulledge Irrevocab
Bought by
Mcgehee Christopher
Purchase Details
Closed on
Dec 14, 2018
Sold by
Gulledge Terry E and Gulledge Diane V
Bought by
Terry E Gulledge Revocable Tru
Purchase Details
Closed on
Dec 3, 2018
Sold by
Gulledge Terry E and Gulledge Diane V
Bought by
Terry E Gulledge Revocable Tru and Diane V Gulledge Revocable Tru
Purchase Details
Closed on
Jun 2, 2000
Sold by
Sipp Richard L and Sipp Vicki P
Bought by
Gulledge Terry Eugene and Gulledge Diane V
Purchase Details
Closed on
Jun 13, 1994
Sold by
Stanley Home Builders
Bought by
Sipp Richard L and Sipp P
Home Financials for this Owner
Home Financials are based on the most recent Mortgage that was taken out on this home.
Original Mortgage
$200,000
Interest Rate
8.61%
Mortgage Type
New Conventional
Create a Home Valuation Report for This Property
The Home Valuation Report is an in-depth analysis detailing your home's value as well as a comparison with similar homes in the area
Home Values in the Area
Average Home Value in this Area
Purchase History
| Date | Buyer | Sale Price | Title Company |
|---|---|---|---|
| Mcgehee Christopher K | -- | None Listed On Document | |
| Mcgehee Christopher | $410,000 | Liberty Title | |
| Terry E Gulledge Revocable Tru | -- | None Listed On Document | |
| Terry E Gulledge Revocable Tru | -- | None Listed On Document | |
| Gulledge Terry Eugene | $375,000 | -- | |
| Sipp Richard L | $275,875 | -- |
Source: Public Records
Mortgage History
| Date | Status | Borrower | Loan Amount |
|---|---|---|---|
| Previous Owner | Sipp Richard L | $200,000 |
Source: Public Records
Tax History Compared to Growth
Tax History
| Year | Tax Paid | Tax Assessment Tax Assessment Total Assessment is a certain percentage of the fair market value that is determined by local assessors to be the total taxable value of land and additions on the property. | Land | Improvement |
|---|---|---|---|---|
| 2025 | $5,984 | $259,870 | $0 | $0 |
| 2024 | $2,851 | $258,910 | $0 | $0 |
| 2023 | $2,639 | $233,400 | $0 | $0 |
| 2022 | $2,932 | $194,100 | $0 | $0 |
| 2021 | $5,281 | $194,100 | $0 | $0 |
| 2020 | $4,480 | $169,060 | $0 | $0 |
| 2019 | $4,417 | $173,230 | $0 | $0 |
| 2018 | $4,365 | $162,240 | $0 | $0 |
| 2017 | $4,127 | $162,240 | $0 | $0 |
| 2016 | $4,104 | $175,410 | $0 | $0 |
| 2014 | $3,169 | $159,530 | $0 | $0 |
| 2012 | $3,169 | $153,340 | $0 | $0 |
Source: Public Records
Map
Nearby Homes
- 7854 Open Meadows Dr
- 57 Wyndam Ln
- 41 Pinemont Dr
- Unit 23 Pine Creek B Rexford Ct
- 25 Rexford Ct
- 31 Pinemont Dr
- 43 Pinemont Dr
- 24 Rexford Ct
- 32 Pinemont Dr
- 44 Pinemont Dr
- 21 Rexford Ct
- 6252 Northridge Hills Dr Unit 66
- 36 Pinemont Dr
- 6240 Northridge Hills Dr
- 6277 Northridge Woods Dr
- 5972 Wyndam Ln
- 15 Wyndam Ln
- 53 Pinemont Dr
- 58 Wyndam Ln
- 5876 Wyndam Ln
- 7713 Hunters Pointe
- 7723 Hunters Point Unit Bldg-Unit
- 7723 Hunters Point
- 7723 Hunters Pointe
- 7708 Hunters Point Unit 11
- 7689 Hunters Point
- 7745 Hunters Point Unit 45
- 7745 Hunters Pointe
- 7692 Hunters Point
- 6952 Summit Ridge
- 7667 Hunters Point
- 7667 Hunters Pointe
- 7752 Lee Rd
- 7761 Lee Rd
- 6934 Summit Ridge
- 6974 Summit Ridge
- 7668 Hunters Point
- 7171 Summit Ridge
- 7193 Summit Ridge
- 7774 Lee Rd