7715 E 400 N Grovertown, IN 46531
Estimated Value: $255,000 - $372,412
3
Beds
1
Bath
1,608
Sq Ft
$187/Sq Ft
Est. Value
About This Home
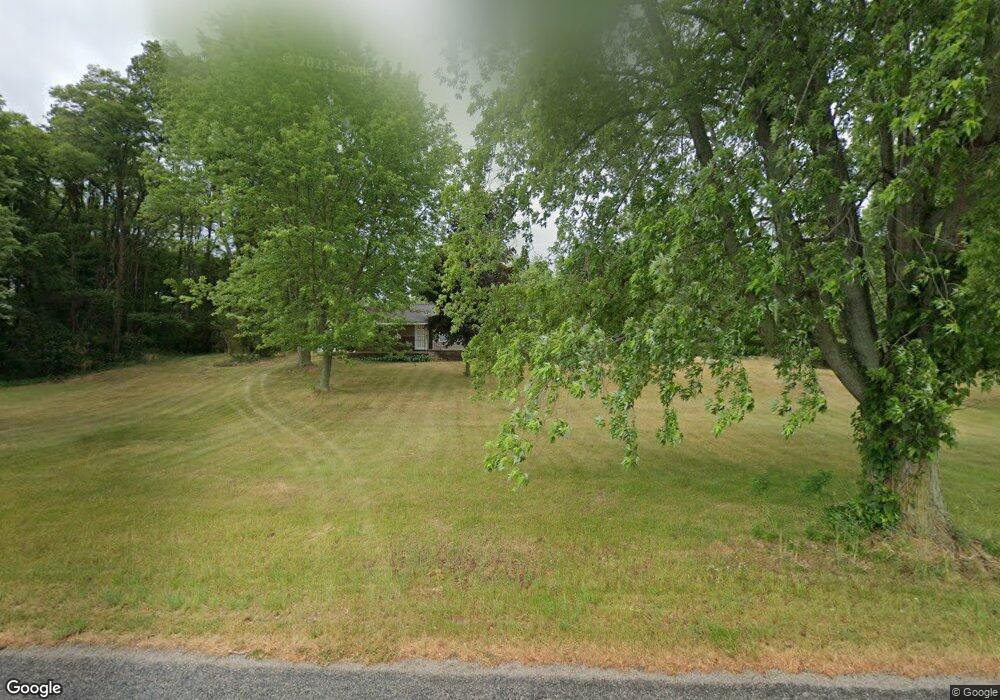
This home is located at 7715 E 400 N, Grovertown, IN 46531 and is currently estimated at $301,137, approximately $187 per square foot. 7715 E 400 N is a home located in Starke County with nearby schools including Oregon-Davis Elementary School and Oregon-Davis Junior/Senior High School.
Ownership History
Date
Name
Owned For
Owner Type
Purchase Details
Closed on
Nov 4, 2019
Sold by
Haloski Mitchel R and Haloski Dolores A
Bought by
Keiper Kyle
Current Estimated Value
Purchase Details
Closed on
Mar 26, 2018
Sold by
Haloski Mitchel R and Haloski Dolores A
Bought by
Keiper Kyle
Purchase Details
Closed on
Mar 5, 2011
Sold by
Haloski Mitchel R and Haloski Dolores A
Bought by
Keiper Kyle
Purchase Details
Closed on
Feb 23, 2011
Sold by
The Haloski Family Revocable Trusy
Bought by
Haloski Mitchel R and Haloski Dolores A
Create a Home Valuation Report for This Property
The Home Valuation Report is an in-depth analysis detailing your home's value as well as a comparison with similar homes in the area
Home Values in the Area
Average Home Value in this Area
Purchase History
| Date | Buyer | Sale Price | Title Company |
|---|---|---|---|
| Keiper Kyle | -- | None Available | |
| Keiper Kyle | -- | Meridican Title Corp | |
| Keiper Kyle | $50,000 | Nichols & Wallsmith | |
| Haloski Mitchel R | -- | None Available |
Source: Public Records
Mortgage History
| Date | Status | Borrower | Loan Amount |
|---|---|---|---|
| Closed | Keiper Kyle | $0 |
Source: Public Records
Tax History Compared to Growth
Tax History
| Year | Tax Paid | Tax Assessment Tax Assessment Total Assessment is a certain percentage of the fair market value that is determined by local assessors to be the total taxable value of land and additions on the property. | Land | Improvement |
|---|---|---|---|---|
| 2024 | $1,931 | $213,700 | $108,700 | $105,000 |
| 2023 | $1,419 | $187,800 | $92,300 | $95,500 |
| 2022 | $1,419 | $163,400 | $74,900 | $88,500 |
| 2021 | $1,293 | $137,700 | $66,100 | $71,600 |
| 2020 | $1,337 | $129,700 | $65,800 | $63,900 |
| 2019 | $1,661 | $142,000 | $80,200 | $61,800 |
| 2018 | $2,273 | $150,200 | $114,700 | $35,500 |
| 2017 | $2,358 | $162,800 | $129,100 | $33,700 |
| 2016 | $2,456 | $173,500 | $135,800 | $37,700 |
| 2014 | $2,280 | $181,500 | $141,400 | $40,100 |
| 2013 | $1,903 | $163,300 | $123,500 | $39,800 |
Source: Public Records
Map
Nearby Homes