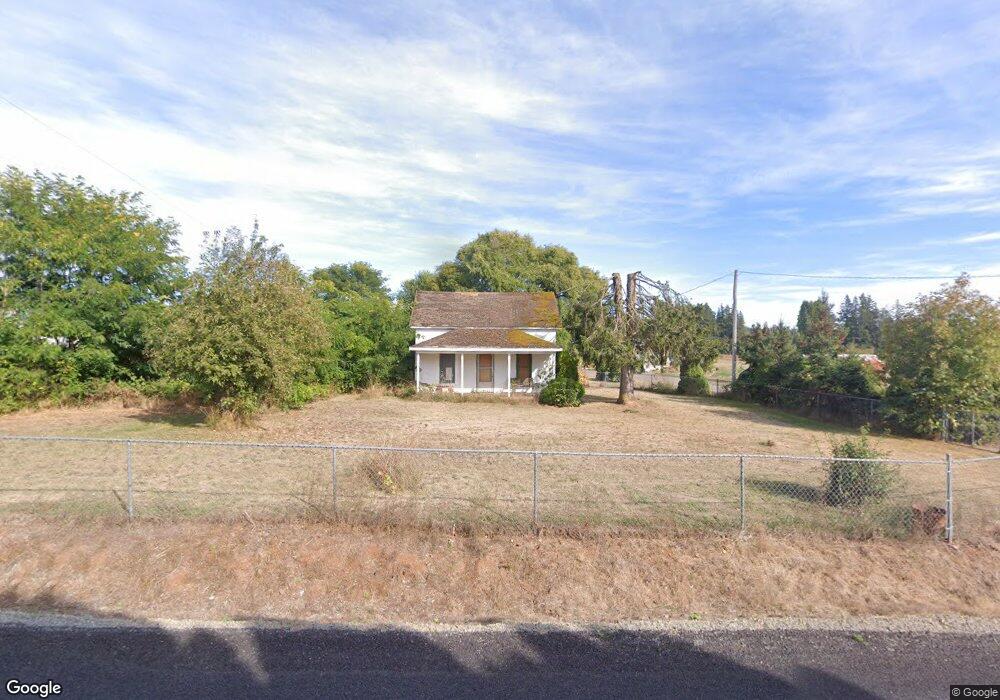
7715 NE 217th Ave Vancouver, WA 98682
Estimated Value: $989,000 - $1,187,665
4
Beds
4
Baths
3,071
Sq Ft
$363/Sq Ft
Est. Value
About This Home
This home is located at 7715 NE 217th Ave, Vancouver, WA 98682 and is currently estimated at $1,115,166, approximately $363 per square foot. 7715 NE 217th Ave is a home located in Clark County with nearby schools including Pioneer Elementary School, Frontier Middle School, and Union High School.
Ownership History
Date
Name
Owned For
Owner Type
Purchase Details
Closed on
Jan 20, 2009
Sold by
Western United Life Assurance Company
Bought by
Ross Ronald J and Ross Jane G
Current Estimated Value
Purchase Details
Closed on
Nov 18, 1998
Sold by
Metropolitan Mtg & Securities Co Inc
Bought by
The Bank Of New York and Metropolitan Asset Funding Inc Ii
Purchase Details
Closed on
Oct 29, 1998
Sold by
Old Standard Life Insurance Company
Bought by
Western United Life Assurance Company
Purchase Details
Closed on
Oct 1, 1998
Sold by
Guardian Mtg Company
Bought by
Old Standard Life Insurance Co
Purchase Details
Closed on
Sep 4, 1998
Sold by
Carper Audrey M
Bought by
Guardian Mtg Company
Create a Home Valuation Report for This Property
The Home Valuation Report is an in-depth analysis detailing your home's value as well as a comparison with similar homes in the area
Home Values in the Area
Average Home Value in this Area
Purchase History
| Date | Buyer | Sale Price | Title Company |
|---|---|---|---|
| Ross Ronald J | $105,000 | None Available | |
| The Bank Of New York | $96,718 | -- | |
| Metropolitan Mtg & Securities Co Inc | $96,718 | -- | |
| Western United Life Assurance Company | -- | -- | |
| Old Standard Life Insurance Co | $96,962 | Transnation Title Insurance | |
| Guardian Mtg Company | $97,205 | Transnation Title Insurance |
Source: Public Records
Mortgage History
| Date | Status | Borrower | Loan Amount |
|---|---|---|---|
| Closed | The Bank Of New York | -- |
Source: Public Records
Tax History Compared to Growth
Tax History
| Year | Tax Paid | Tax Assessment Tax Assessment Total Assessment is a certain percentage of the fair market value that is determined by local assessors to be the total taxable value of land and additions on the property. | Land | Improvement |
|---|---|---|---|---|
| 2025 | $9,091 | $973,357 | $363,281 | $610,076 |
| 2024 | $8,708 | $941,071 | $363,281 | $577,790 |
| 2023 | $8,345 | $937,880 | $342,254 | $595,626 |
| 2022 | $7,599 | $885,227 | $295,980 | $589,247 |
| 2021 | $3,876 | $752,629 | $244,500 | $508,129 |
| 2020 | $3,644 | $356,970 | $235,920 | $121,050 |
| 2019 | $3,096 | $343,638 | $227,340 | $116,298 |
| 2018 | $3,874 | $315,500 | $0 | $0 |
| 2017 | $3,060 | $316,862 | $0 | $0 |
| 2016 | $3,061 | $262,297 | $0 | $0 |
| 2015 | $2,883 | $244,535 | $0 | $0 |
| 2014 | -- | $219,362 | $0 | $0 |
| 2013 | -- | $207,872 | $0 | $0 |
Source: Public Records
Map
Nearby Homes
- 8101 NE 229th Ct
- 19703 NE 68th St
- 5610 NE 207th Ave
- 5611 NE 204th Ct
- 18908 NE 65th St
- 18505 NE 78th Way
- 23505 NE 105th St
- 5100 NE 204th Ct
- 18803 NE 65th St
- 0 NE 197th Ave
- 18301 NE 78th Cir
- 22505 NE 113th St
- 8614 NE 183rd Place
- 13509 NE 87th Way Unit Lot 157
- 18206 NE 87th Way
- 8702 NE 182nd Place
- 20401 NE 116th Cir
- 17613 NE 75th Cir
- 10808 NE 192nd Ave
- 5741 N 94th Ave Unit LT241
- 7616 NE 217th Ave
- 7710 NE 217th Ave
- 7812 NE 217th Ave
- 8003 NE 217th Ave
- 7809 NE 217th Ave
- 7805 NE 217th Ave
- 7401 NE 217th Ave
- 7407 NE 217th Ave
- 8113 NE 217th Ave
- 8104 NE 219th Ave
- 7413 NE 217th Ave
- 7408 NE 217th Ave
- 8114 NE 217th Ave
- 8101 NE 219th Ave
- 7422 NE 217th Ave
- 7630 NE 217th Ave
- 8117 NE 217th Ave
- 8114 NE 219th Ave
- 22027 NE 83rd St
- 7428 NE 217th Ave