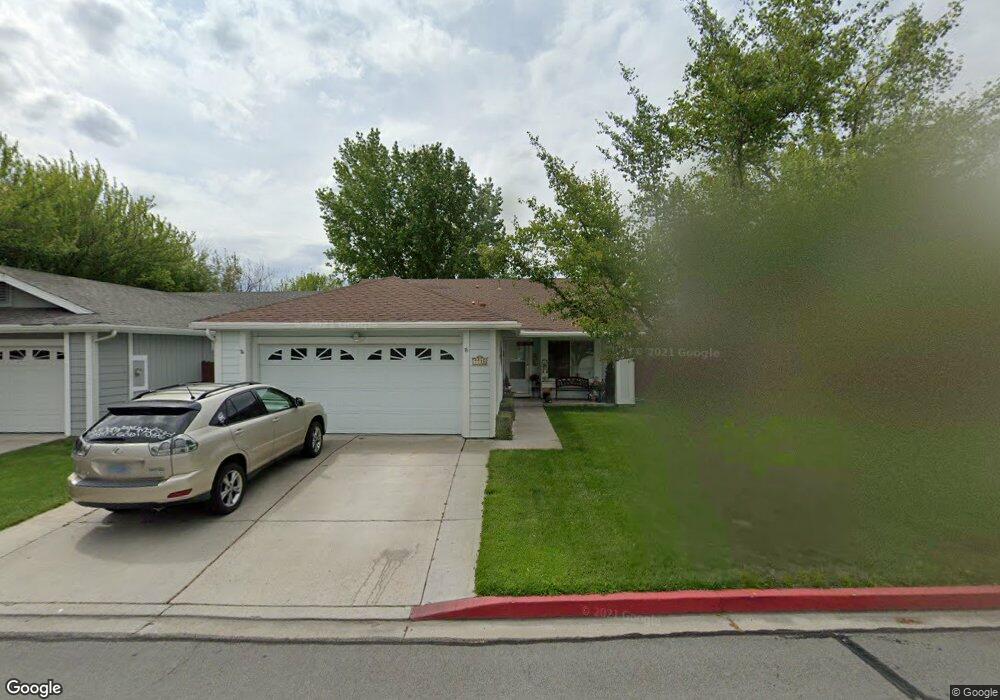
7715 Pickering Cir Unit 4 Reno, NV 89511
Bartley Ranch NeighborhoodEstimated Value: $480,000 - $510,000
3
Beds
2
Baths
1,288
Sq Ft
$386/Sq Ft
Est. Value
About This Home
This home is located at 7715 Pickering Cir Unit 4, Reno, NV 89511 and is currently estimated at $496,790, approximately $385 per square foot. 7715 Pickering Cir Unit 4 is a home located in Washoe County with nearby schools including Huffaker Elementary School, Edward L Pine Middle School, and Reno High School.
Ownership History
Date
Name
Owned For
Owner Type
Purchase Details
Closed on
Sep 21, 2020
Sold by
Gifford David I
Bought by
Gifford David I and The Home Means Nevada Living T
Current Estimated Value
Purchase Details
Closed on
Aug 8, 2002
Sold by
Flatt Michael J and Flatt Stephanie D
Bought by
Gifford David I
Home Financials for this Owner
Home Financials are based on the most recent Mortgage that was taken out on this home.
Original Mortgage
$124,000
Outstanding Balance
$52,320
Interest Rate
6.51%
Estimated Equity
$444,470
Purchase Details
Closed on
Jan 13, 1994
Sold by
Dale Poe Development Corp
Bought by
Flatt Michael J and Flatt Stephanie D
Home Financials for this Owner
Home Financials are based on the most recent Mortgage that was taken out on this home.
Original Mortgage
$106,880
Interest Rate
7.16%
Mortgage Type
FHA
Create a Home Valuation Report for This Property
The Home Valuation Report is an in-depth analysis detailing your home's value as well as a comparison with similar homes in the area
Home Values in the Area
Average Home Value in this Area
Purchase History
| Date | Buyer | Sale Price | Title Company |
|---|---|---|---|
| Gifford David I | -- | None Available | |
| Gifford David I | $163,000 | First American Title | |
| Flatt Michael J | $108,000 | Comstock Title Company |
Source: Public Records
Mortgage History
| Date | Status | Borrower | Loan Amount |
|---|---|---|---|
| Open | Gifford David I | $124,000 | |
| Previous Owner | Flatt Michael J | $106,880 |
Source: Public Records
Tax History Compared to Growth
Tax History
| Year | Tax Paid | Tax Assessment Tax Assessment Total Assessment is a certain percentage of the fair market value that is determined by local assessors to be the total taxable value of land and additions on the property. | Land | Improvement |
|---|---|---|---|---|
| 2025 | $1,968 | $82,088 | $36,855 | $45,233 |
| 2024 | $1,968 | $81,100 | $36,120 | $44,980 |
| 2023 | $1,911 | $78,418 | $35,700 | $42,718 |
| 2022 | $1,859 | $65,762 | $29,995 | $35,767 |
| 2021 | $1,801 | $59,434 | $23,625 | $35,809 |
| 2020 | $1,745 | $57,223 | $21,210 | $36,013 |
| 2019 | $1,695 | $55,486 | $20,545 | $34,941 |
| 2018 | $1,642 | $48,776 | $14,455 | $34,321 |
| 2017 | $1,598 | $48,964 | $14,455 | $34,509 |
| 2016 | $1,557 | $47,701 | $12,460 | $35,241 |
| 2015 | $765 | $44,901 | $10,780 | $34,121 |
| 2014 | $1,471 | $41,972 | $8,750 | $33,222 |
| 2013 | -- | $38,575 | $6,510 | $32,065 |
Source: Public Records
Map
Nearby Homes
- 7554 Whimbleton Way Unit 6
- 831 Blue Falls Place
- 7187 Blue Falls Cir
- 1145 Country Estates Cir
- 8620 Dixon Ln
- 555 E Patriot Blvd Unit 276
- 555 E Patriot Blvd Unit M262
- 555 E Patriot Blvd Unit 218
- 555 E Patriot Blvd Unit 170
- 8820 Dixon Ln
- 530 E Patriot Blvd Unit B114
- 6421 Bonde Farms Ln
- 450 Len Cir
- 8999 Panorama Dr
- 7274 Windmill Dr
- 1865 Olive Ln
- 84 Caballada St Unit 15-1
- 81 Caballada St
- 83 Caballada St Unit 14-1
- 180 Gallian Ln
- 7721 Pickering Cir
- 7687 Pickering Cir Unit 4
- 7681 Pickering Cir
- 7712 Barnsdale Rd
- 7675 Pickering Cir
- 7722 Pickering Cir
- 7706 Barnsdale Rd
- 7716 Pickering Cir
- 7686 Barnsdale Rd
- 7718 Barnsdale Rd
- 7680 Barnsdale Rd
- 7728 Pickering Cir
- 7710 Pickering Cir
- 7674 Barnsdale Rd
- 7734 Pickering Cir
- 7704 Pickering Cir
- 7740 Pickering Cir
- 7698 Pickering Cir
- 7692 Pickering Cir
- 7686 Pickering Cir Unit 4