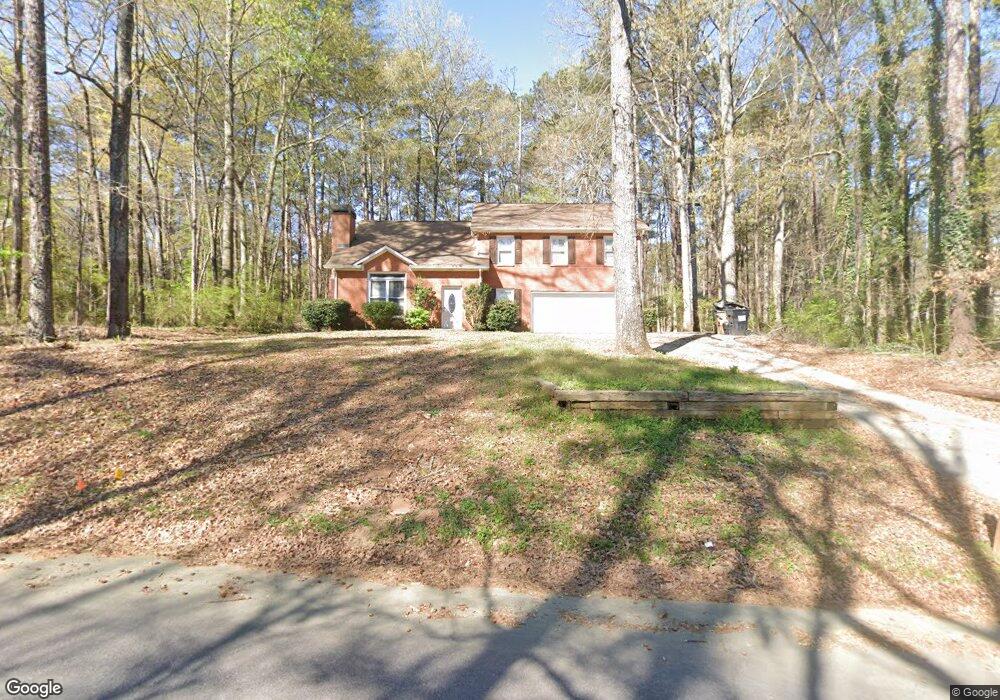
7715 Wethersfield Dr Jonesboro, GA 30236
Estimated Value: $297,480 - $386,000
4
Beds
4
Baths
2,910
Sq Ft
$113/Sq Ft
Est. Value
About This Home
This home is located at 7715 Wethersfield Dr, Jonesboro, GA 30236 and is currently estimated at $327,870, approximately $112 per square foot. 7715 Wethersfield Dr is a home located in Clayton County with nearby schools including Mt. Zion Primary School, Mount Zion Elementary School, and M. D. Roberts Middle School.
Ownership History
Date
Name
Owned For
Owner Type
Purchase Details
Closed on
Feb 16, 2017
Sold by
Mazile Macsims
Bought by
Mazile Macsims and Carr Emmanuella Arnaud
Current Estimated Value
Home Financials for this Owner
Home Financials are based on the most recent Mortgage that was taken out on this home.
Original Mortgage
$156,120
Outstanding Balance
$130,453
Interest Rate
4.62%
Mortgage Type
FHA
Estimated Equity
$197,417
Purchase Details
Closed on
Oct 15, 2009
Sold by
Allen Helen H
Bought by
Hanania Mary J
Purchase Details
Closed on
Dec 29, 1999
Sold by
Mayben Gordon R and Mayben Donna L
Bought by
Westervelt John L and Westervelt Victoria F
Home Financials for this Owner
Home Financials are based on the most recent Mortgage that was taken out on this home.
Original Mortgage
$75,000
Interest Rate
7.87%
Mortgage Type
New Conventional
Create a Home Valuation Report for This Property
The Home Valuation Report is an in-depth analysis detailing your home's value as well as a comparison with similar homes in the area
Home Values in the Area
Average Home Value in this Area
Purchase History
| Date | Buyer | Sale Price | Title Company |
|---|---|---|---|
| Mazile Macsims | -- | -- | |
| Mazile Macsims | $159,000 | -- | |
| Hanania Mary J | -- | -- | |
| Westervelt John L | $60,000 | -- |
Source: Public Records
Mortgage History
| Date | Status | Borrower | Loan Amount |
|---|---|---|---|
| Open | Mazile Macsims | $156,120 | |
| Closed | Mazile Macsims | $156,120 | |
| Previous Owner | Westervelt John L | $75,000 |
Source: Public Records
Tax History Compared to Growth
Tax History
| Year | Tax Paid | Tax Assessment Tax Assessment Total Assessment is a certain percentage of the fair market value that is determined by local assessors to be the total taxable value of land and additions on the property. | Land | Improvement |
|---|---|---|---|---|
| 2024 | $2,943 | $85,440 | $9,600 | $75,840 |
| 2023 | $2,110 | $86,440 | $9,600 | $76,840 |
| 2022 | $2,364 | $70,240 | $9,600 | $60,640 |
| 2021 | $2,299 | $68,200 | $9,600 | $58,600 |
| 2020 | $2,960 | $83,998 | $9,600 | $74,398 |
| 2019 | $2,863 | $80,516 | $8,000 | $72,516 |
| 2018 | $2,176 | $63,600 | $8,000 | $55,600 |
| 2017 | $2,301 | $73,136 | $8,000 | $65,136 |
| 2016 | $2,078 | $51,056 | $8,000 | $43,056 |
| 2015 | $2,063 | $0 | $0 | $0 |
| 2014 | $1,956 | $49,178 | $8,000 | $41,178 |
Source: Public Records
Map
Nearby Homes
- 2238 Danver Ct
- 1938 Wrights Way
- 2115 Logan Dr
- 7583 Sunstone Dr
- 1837 Coventry Way
- 7621 Raleigh Ln
- 1904 Cades Cove
- 2254 Lisbon Ln
- 7672 Echo Ln
- 7581 Livingston Dr
- 7942 Rand Rd
- 7620 Mount Zion Blvd
- 7972 Woods Ln Unit IX
- 7455 Page Ct
- 7519 Conkle Rd Unit 2
- 7940 Rand Rd
- 1753 Brenda Dr
- 1699 Brenda Dr Unit 2
- 2140 Indian Hill Rd
- 0 Highway 138 E Unit 10460006
- 7715 Westhersfield Dr
- 7681 Kennington Ln
- 7737 Wethersfield Dr
- 7716 Sherman Rd Unit 2
- 7691 Kennington Ln Unit 2
- 7706 Sherman Rd
- 0 Wethersfield Dr Unit 8663002
- 0 Wethersfield Dr Unit 7357122
- 7675 Kennington Ln Unit 2
- 7749 Wethersfield Dr Unit 2
- 7726 Wethersfield Dr
- 7697 Kennington Ln Unit 11
- 7697 Kennington Ln
- 7669 Kennington Ln Unit 2
- 7688 Kennington Ln
- 7738 Wethersfield Dr
- 7694 Kennington Ln
- 7680 Kennington Ln Unit 2
- 7755 Wethersfield Dr
- 7746 Sherman Rd