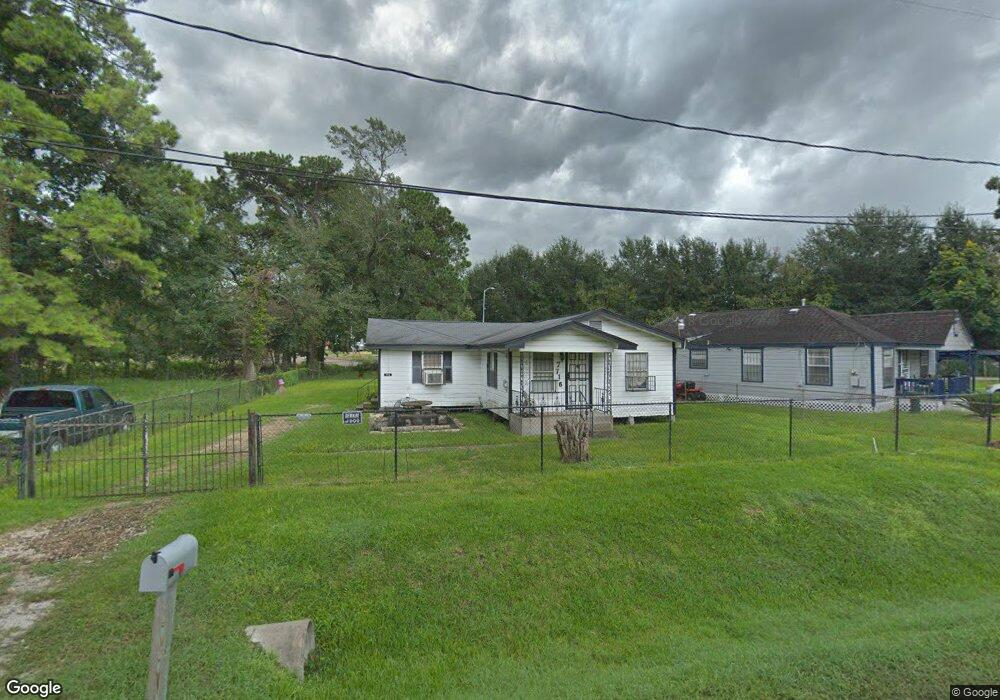
7716 Hoffman St Houston, TX 77016
Trinity-Houston Gardens NeighborhoodEstimated Value: $128,000 - $153,000
3
Beds
1
Bath
1,000
Sq Ft
$137/Sq Ft
Est. Value
About This Home
This home is located at 7716 Hoffman St, Houston, TX 77016 and is currently estimated at $137,018, approximately $137 per square foot. 7716 Hoffman St is a home located in Harris County with nearby schools including Felix Cook Jr. Elementary School, Key Middle, and Kashmere High School.
Create a Home Valuation Report for This Property
The Home Valuation Report is an in-depth analysis detailing your home's value as well as a comparison with similar homes in the area
Home Values in the Area
Average Home Value in this Area
Tax History Compared to Growth
Tax History
| Year | Tax Paid | Tax Assessment Tax Assessment Total Assessment is a certain percentage of the fair market value that is determined by local assessors to be the total taxable value of land and additions on the property. | Land | Improvement |
|---|---|---|---|---|
| 2025 | $1,897 | $100,110 | $54,366 | $45,744 |
| 2024 | $1,897 | $90,658 | $51,259 | $39,399 |
| 2023 | $1,827 | $90,658 | $46,599 | $44,059 |
| 2022 | $1,588 | $72,118 | $38,833 | $33,285 |
| 2021 | $1,181 | $50,663 | $19,416 | $31,247 |
| 2020 | $1,152 | $47,585 | $19,416 | $28,169 |
| 2019 | $1,044 | $47,585 | $19,416 | $28,169 |
| 2018 | $0 | $37,506 | $17,475 | $20,031 |
| 2017 | $948 | $37,506 | $17,475 | $20,031 |
| 2016 | $914 | $36,134 | $17,475 | $18,659 |
| 2015 | -- | $34,008 | $17,475 | $16,533 |
| 2014 | -- | $34,008 | $17,475 | $16,533 |
Source: Public Records
Map
Nearby Homes
- 8312 Hoffman St
- RES 11 Shotwell St
- TBD Shotwell St
- 7803 Sandra St Unit A/B
- 7904 Hoffman St
- 7807 Sandra St Unit A/B
- 0 Sandra St Unit 33902265
- 7524 Peachtree St
- 6601 Landor St
- 7910 Allwood St
- 5123 E Crosstimbers St
- 6705 Roanoke St
- 7711 Wileyvale Rd
- 6714 E Crosstimbers
- 6719 Roanoke St
- 0 Peachtree St Unit 21922779
- 0 Peachtree St Unit 3094206
- 0 Peachtree St Unit 19233458
- 6606 Weaver Rd
- 0 Shreveport Blvd
- 7713 Hoffman St
- 7712 Hoffman St
- 7717 Hoffman St
- 7720 Hoffman St
- 7709 Hoffman St Unit B
- 7709 Hoffman St
- 7703 Hoffman St
- 0 Dandy St
- 7720 Shotwell St
- 7810 Dandy St
- 7726 Shotwell St
- 7714 Shotwell St
- 7708 Shotwell St
- 7800 Hoffman St
- 7730 Shotwell St
- 7612 Shotwell St
- 7610 Shotwell St
- 7606 Shotwell St
- 7734 Shotwell St
- 7803 Hoffman St