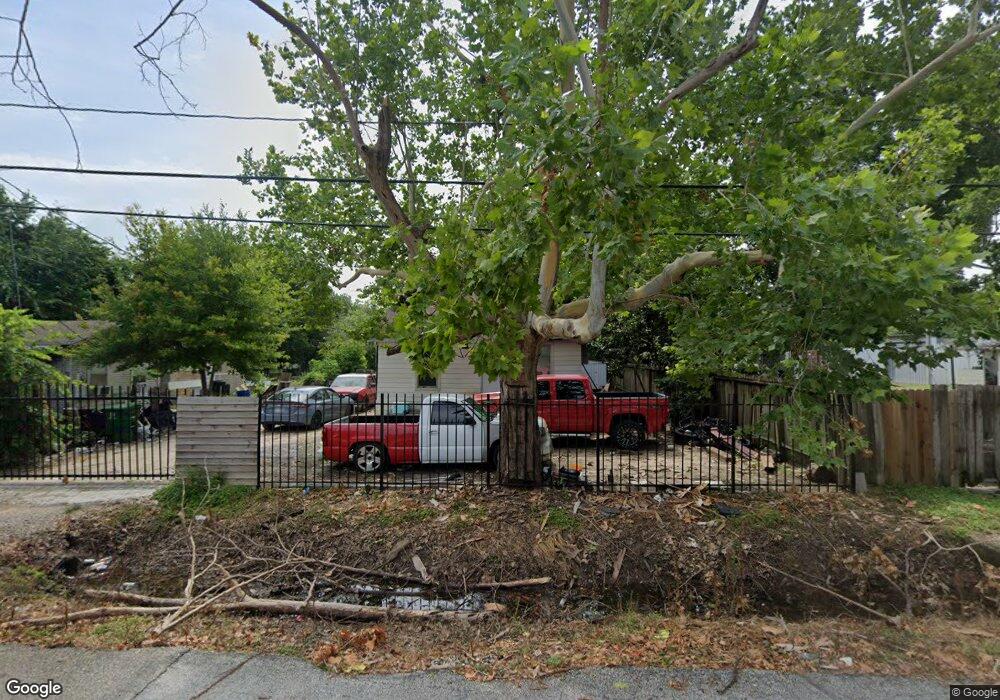
7718 Magna St Houston, TX 77093
Eastex-Jensen NeighborhoodEstimated Value: $106,646 - $166,000
2
Beds
1
Bath
884
Sq Ft
$152/Sq Ft
Est. Value
About This Home
This home is located at 7718 Magna St, Houston, TX 77093 and is currently estimated at $134,412, approximately $152 per square foot. 7718 Magna St is a home located in Harris County with nearby schools including Roderick R. Paige Elementary School, Key Middle, and Kashmere High School.
Ownership History
Date
Name
Owned For
Owner Type
Purchase Details
Closed on
May 8, 2020
Sold by
Chavez Albert and Chavez Procora
Bought by
Munoz Jorge A and Chavez Beatris Munoz
Current Estimated Value
Home Financials for this Owner
Home Financials are based on the most recent Mortgage that was taken out on this home.
Original Mortgage
$65,000
Interest Rate
3.2%
Mortgage Type
Commercial
Purchase Details
Closed on
Apr 14, 2003
Sold by
Castillo Roberto Nmi
Bought by
Chavez Alberto and Chavez Procora
Home Financials for this Owner
Home Financials are based on the most recent Mortgage that was taken out on this home.
Original Mortgage
$32,000
Interest Rate
5.64%
Mortgage Type
Purchase Money Mortgage
Purchase Details
Closed on
Mar 5, 2003
Sold by
Phillips Brenda C
Bought by
Castillo Roberto
Home Financials for this Owner
Home Financials are based on the most recent Mortgage that was taken out on this home.
Original Mortgage
$32,000
Interest Rate
5.64%
Mortgage Type
Purchase Money Mortgage
Create a Home Valuation Report for This Property
The Home Valuation Report is an in-depth analysis detailing your home's value as well as a comparison with similar homes in the area
Home Values in the Area
Average Home Value in this Area
Purchase History
| Date | Buyer | Sale Price | Title Company |
|---|---|---|---|
| Munoz Jorge A | -- | None Available | |
| Chavez Alberto | -- | -- | |
| Castillo Roberto | -- | American Title Co |
Source: Public Records
Mortgage History
| Date | Status | Borrower | Loan Amount |
|---|---|---|---|
| Previous Owner | Munoz Jorge A | $65,000 | |
| Previous Owner | Chavez Alberto | $32,000 | |
| Previous Owner | Castillo Roberto | $28,000 |
Source: Public Records
Tax History Compared to Growth
Tax History
| Year | Tax Paid | Tax Assessment Tax Assessment Total Assessment is a certain percentage of the fair market value that is determined by local assessors to be the total taxable value of land and additions on the property. | Land | Improvement |
|---|---|---|---|---|
| 2025 | $1,971 | $96,391 | $60,800 | $35,591 |
| 2024 | $1,971 | $94,179 | $60,800 | $33,379 |
| 2023 | $1,971 | $106,550 | $48,000 | $58,550 |
| 2022 | $1,873 | $85,048 | $36,000 | $49,048 |
| 2021 | $1,589 | $68,177 | $28,000 | $40,177 |
| 2020 | $1,506 | $62,171 | $28,000 | $34,171 |
| 2019 | $1,573 | $62,171 | $28,000 | $34,171 |
| 2018 | $1,231 | $48,648 | $22,000 | $26,648 |
| 2017 | $1,230 | $48,648 | $22,000 | $26,648 |
| 2016 | $1,230 | $48,648 | $22,000 | $26,648 |
| 2015 | $1,318 | $51,255 | $22,000 | $29,255 |
| 2014 | $1,318 | $51,255 | $22,000 | $29,255 |
Source: Public Records
Map
Nearby Homes
- 4009 Yorkshire St
- 3529 Toliver St
- 4114 E Toliver E Street St
- 4114 E Toliver St
- 4006 Yorkshire St
- 3607 Penn St
- 4129 E Toliver St
- 4133 E Toliver St
- 4217 E Toliver St
- 7511 Hirsch Rd
- 4221 E Toliver St
- 4209 Tampico St
- 4225 Denmark St
- 4315 Plaag St
- 4317 Plaag St
- 7508 Glass St
- 7202 Los Angeles St
- 4419 Denmark St
- 3711 Dorchester St
- 3911 Dorchester St
- 7722 Magna St
- 7712 Magna St
- 3617 Toliver St
- 3610 Toliver St
- 7807 Magna St
- 7703 Sayers St
- 7715 Magna St
- 7814 Magna St
- 7707 Sayers St
- 7711 Sayers St
- 4009 E Crosstimbers St
- 7815 Magna St
- 7719 Sayers St
- 3611 Toliver St
- 7715 Sayers St
- 3606 Toliver St
- 7820 Magna St
- 3605 Toliver St
- 7819 Magna St
- 3601 Toliver St