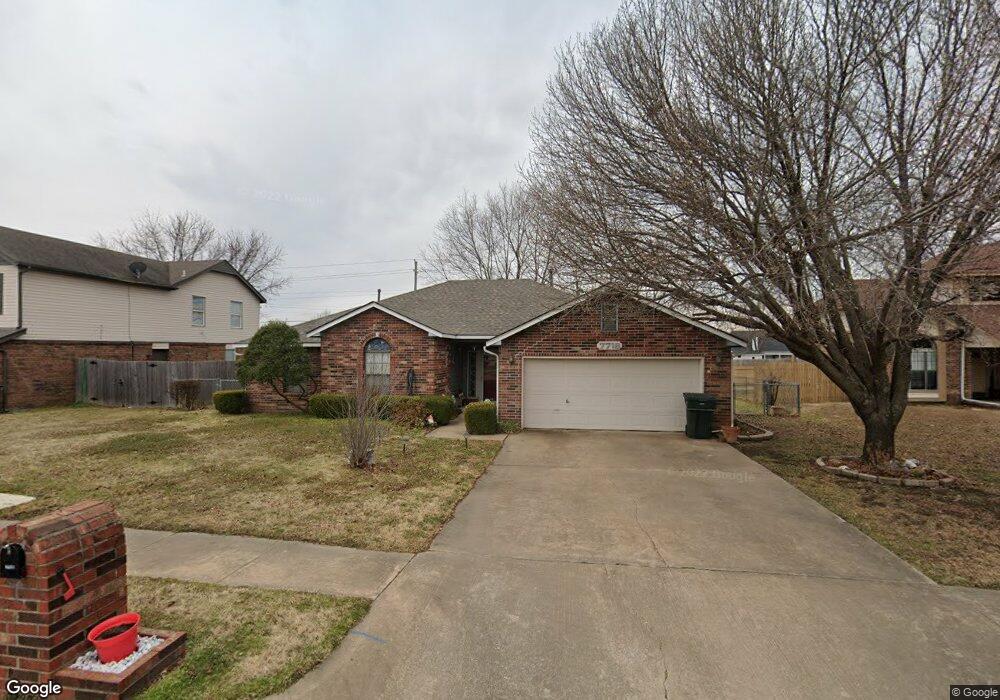
7718 N 130th East Ave Owasso, OK 74055
Estimated Value: $260,406 - $266,000
--
Bed
2
Baths
1,902
Sq Ft
$138/Sq Ft
Est. Value
About This Home
This home is located at 7718 N 130th East Ave, Owasso, OK 74055 and is currently estimated at $263,102, approximately $138 per square foot. 7718 N 130th East Ave is a home located in Tulsa County with nearby schools including Mills Elementary School, Owasso 6th Grade Center, and Owasso 8th Grade Center.
Ownership History
Date
Name
Owned For
Owner Type
Purchase Details
Closed on
Aug 25, 2006
Sold by
Wolfe Doris M
Bought by
Wolfe Doris M and Doris M Wolfe Revocable Living Trust
Current Estimated Value
Home Financials for this Owner
Home Financials are based on the most recent Mortgage that was taken out on this home.
Original Mortgage
$54,900
Outstanding Balance
$33,015
Interest Rate
6.79%
Mortgage Type
Unknown
Estimated Equity
$230,087
Purchase Details
Closed on
Aug 15, 2006
Sold by
Smith Michael Erwin and Smith Nelda J
Bought by
Wolfe Doris M
Home Financials for this Owner
Home Financials are based on the most recent Mortgage that was taken out on this home.
Original Mortgage
$54,900
Outstanding Balance
$33,015
Interest Rate
6.79%
Mortgage Type
Unknown
Estimated Equity
$230,087
Purchase Details
Closed on
Jun 30, 1997
Sold by
Mckenzie V Ann
Bought by
Smith Michael Erwin and Smith Nelda J
Purchase Details
Closed on
Oct 1, 1992
Create a Home Valuation Report for This Property
The Home Valuation Report is an in-depth analysis detailing your home's value as well as a comparison with similar homes in the area
Home Values in the Area
Average Home Value in this Area
Purchase History
| Date | Buyer | Sale Price | Title Company |
|---|---|---|---|
| Wolfe Doris M | -- | None Available | |
| Wolfe Doris M | $130,000 | Multiple | |
| Smith Michael Erwin | $104,000 | Tulsa Abstract & Title Co | |
| -- | $86,000 | -- |
Source: Public Records
Mortgage History
| Date | Status | Borrower | Loan Amount |
|---|---|---|---|
| Open | Wolfe Doris M | $54,900 |
Source: Public Records
Tax History Compared to Growth
Tax History
| Year | Tax Paid | Tax Assessment Tax Assessment Total Assessment is a certain percentage of the fair market value that is determined by local assessors to be the total taxable value of land and additions on the property. | Land | Improvement |
|---|---|---|---|---|
| 2024 | $1,339 | $12,300 | $1,050 | $11,250 |
| 2023 | $1,339 | $14,300 | $1,222 | $13,078 |
| 2022 | $1,398 | $12,300 | $1,409 | $10,891 |
| 2021 | $1,384 | $12,300 | $1,607 | $10,693 |
| 2020 | $1,384 | $12,300 | $1,607 | $10,693 |
| 2019 | $1,378 | $12,300 | $1,607 | $10,693 |
| 2018 | $1,335 | $12,300 | $1,607 | $10,693 |
| 2017 | $1,339 | $14,300 | $2,277 | $12,023 |
| 2016 | $1,344 | $14,300 | $2,277 | $12,023 |
| 2015 | $1,354 | $14,300 | $2,277 | $12,023 |
| 2014 | $1,366 | $14,300 | $2,277 | $12,023 |
Source: Public Records
Map
Nearby Homes
- 13026 E 77th Ct N
- 7902 N 125th East Ave
- 13109 E 79th Ct N
- 13111 E 80th St N
- 13135 E 76th St N
- 7529 N 129th East Ave
- 7602 N 127th East Ave
- 8001 N 128th East Ave
- 7841 N 134th East Ave
- 12700 E 82nd St N
- 7515 N 134th East Ave
- 9930 N Garnett
- 7607 N 122nd East Ave
- 7492 N 133rd East Ave
- 12105 E 76th Place N
- 12207 E 82nd Place N
- 8102 N 121st East Ave
- 8214 N 122nd East Ave
- 8304 N 124th Ave E
- 11805 E 80th St N
- 7722 N 130th Ave E
- 7714 N 130th East Ave
- 7722 N 130th East Ave
- 7710 N 130th Ave E
- 7710 N 130th East Ave
- 7726 N 130th East Ave
- 7709 N 130th East Ave
- 7706 N 130th East Ave
- 7713 N 128th East Ave
- 7801 N 128th East Ave
- 7705 N 130th East Ave
- 7800 N 130th East Ave
- 7711 N 128th East Ave
- 13006 E 77th Ct N
- 7803 N 128th East Ave
- 7709 N 128th East Ave
- 13025 E 77th Ct N
- 7807 N 130th Ave E
- 12903 E 77th St N
- 12907 E 77th St N