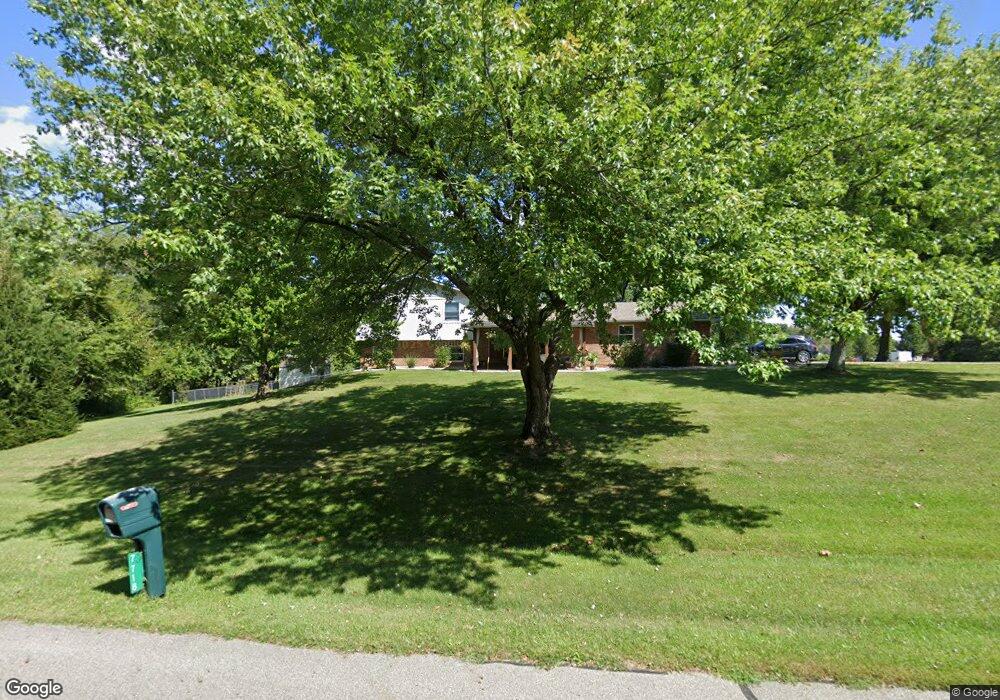
7718 Otterbein Trail NW Lancaster, OH 43130
Bloom NeighborhoodEstimated Value: $327,000 - $356,000
3
Beds
3
Baths
2,184
Sq Ft
$154/Sq Ft
Est. Value
About This Home
This home is located at 7718 Otterbein Trail NW, Lancaster, OH 43130 and is currently estimated at $336,246, approximately $153 per square foot. 7718 Otterbein Trail NW is a home located in Fairfield County with nearby schools including Bloom Carroll Primary School, Bloom Carroll Intermediate School, and Bloom-Carroll Middle School.
Ownership History
Date
Name
Owned For
Owner Type
Purchase Details
Closed on
Sep 11, 2007
Sold by
Lasalle Bank Na
Bought by
Spires Matthew K
Current Estimated Value
Home Financials for this Owner
Home Financials are based on the most recent Mortgage that was taken out on this home.
Original Mortgage
$135,850
Outstanding Balance
$84,947
Interest Rate
6.33%
Mortgage Type
Purchase Money Mortgage
Estimated Equity
$251,299
Purchase Details
Closed on
Apr 16, 2007
Sold by
Burch Joseph F and Mcgovern Tonya D
Bought by
Lasalle Bank Na and Structured Asset Securities Corp Structu
Purchase Details
Closed on
Jun 7, 2002
Sold by
Green Connie L
Bought by
Burch Joseph F and Mcgovern Tonya D
Home Financials for this Owner
Home Financials are based on the most recent Mortgage that was taken out on this home.
Original Mortgage
$128,000
Interest Rate
6.99%
Mortgage Type
New Conventional
Purchase Details
Closed on
Apr 7, 1997
Sold by
Keys Gail A
Bought by
Connie L Green
Home Financials for this Owner
Home Financials are based on the most recent Mortgage that was taken out on this home.
Original Mortgage
$35,000
Interest Rate
7.65%
Mortgage Type
New Conventional
Create a Home Valuation Report for This Property
The Home Valuation Report is an in-depth analysis detailing your home's value as well as a comparison with similar homes in the area
Home Values in the Area
Average Home Value in this Area
Purchase History
| Date | Buyer | Sale Price | Title Company |
|---|---|---|---|
| Spires Matthew K | $143,000 | Resource Title Of Cincinnati | |
| Lasalle Bank Na | $156,462 | None Available | |
| Burch Joseph F | $160,000 | -- | |
| Connie L Green | $133,500 | -- |
Source: Public Records
Mortgage History
| Date | Status | Borrower | Loan Amount |
|---|---|---|---|
| Open | Spires Matthew K | $135,850 | |
| Previous Owner | Burch Joseph F | $128,000 | |
| Previous Owner | Connie L Green | $35,000 |
Source: Public Records
Tax History Compared to Growth
Tax History
| Year | Tax Paid | Tax Assessment Tax Assessment Total Assessment is a certain percentage of the fair market value that is determined by local assessors to be the total taxable value of land and additions on the property. | Land | Improvement |
|---|---|---|---|---|
| 2024 | $7,142 | $86,670 | $19,270 | $67,400 |
| 2023 | $3,633 | $85,830 | $19,270 | $66,560 |
| 2022 | $3,661 | $85,830 | $19,270 | $66,560 |
| 2021 | $3,297 | $69,600 | $17,050 | $52,550 |
| 2020 | $3,320 | $69,600 | $17,050 | $52,550 |
| 2019 | $3,330 | $69,600 | $17,050 | $52,550 |
| 2018 | $2,687 | $49,150 | $12,600 | $36,550 |
| 2017 | $2,532 | $56,820 | $12,600 | $44,220 |
| 2016 | $2,494 | $56,820 | $12,600 | $44,220 |
| 2015 | $2,389 | $52,910 | $12,600 | $40,310 |
| 2014 | $2,292 | $52,910 | $12,600 | $40,310 |
| 2013 | $2,292 | $52,910 | $12,600 | $40,310 |
Source: Public Records
Map
Nearby Homes
- 7835 E Ohio State Ln NW
- 839 Rockmill Rd NW
- 8642 Water St
- 9605 Royalton Rd SW
- 7985 Lithopolis Rd NW
- 1975 Lamb Rd NW
- 10 Mount Zion Rd NW
- 681 Mount Zion Rd SW
- 8416 Royalton Rd SW
- 8245 Royalton Rd SW
- 8143 Royalton Rd SW
- 8485 Westfall Rd SW
- 5550 Westfall Rd SW
- 8322 Benson Rd
- 1219 W Slate Ridge Dr
- 2780 Cedar Hill Rd NW
- 4180 Stone Hill Drive East NW
- 10385 Lithopolis Rd NW
- 5701 Lancaster-Circleville Rd SW
- 00 Duncan Rd SW
- 381 Capital Ln NW
- 7752 Otterbein Trail NW
- 7709 Otterbein Trail NW
- 7674 Otterbein Trail NW
- 7675 Oberlin Ct NW
- 7665 Otterbein Trail NW
- 7751 Otterbein Trail NW
- 7786 Otterbein Trail NW
- 7644 Otterbein Trail NW
- 7616 E Ohio State Ln NW
- 7694 Oberlin Ct NW
- 7633 Otterbein Trail NW
- 7779 Otterbein Trail NW
- 7824 Otterbein Trail NW
- 7616 Otterbein Trail NW
- 7827 Otterbein Trail NW
- 7627 Oberlin Ct NW
- 7652 Oberlin Ct NW
- 7635 E Ohio State Ln NW
- 7436 E Bowling Green Ln NW