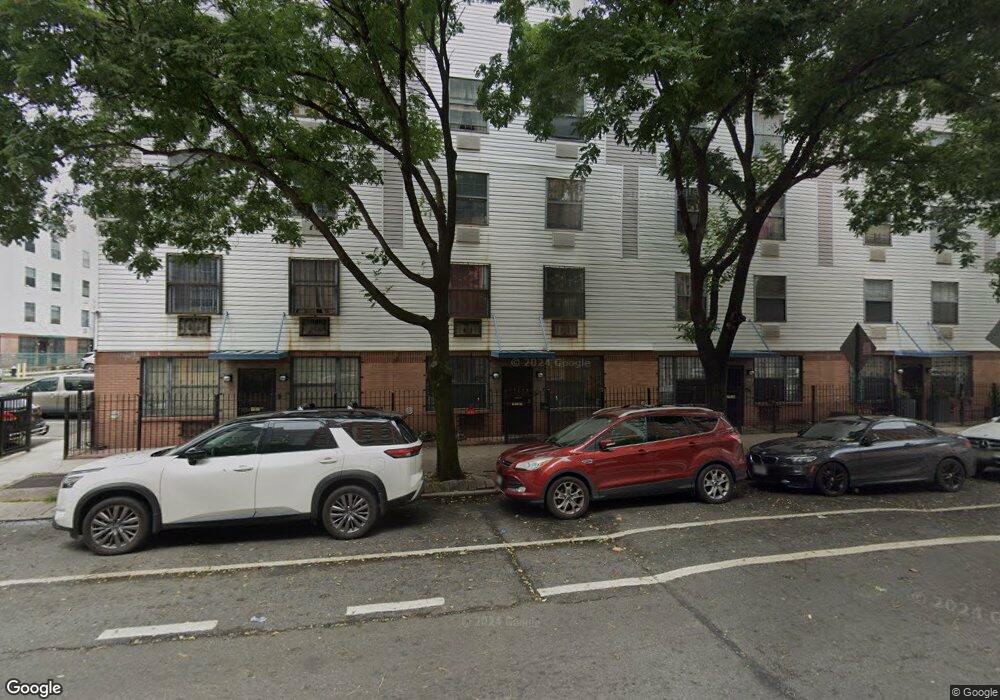
771C Saint Anns Ave Unit 43C Bronx, NY 10456
Woodstock NeighborhoodEstimated Value: $317,358 - $493,000
--
Bed
--
Bath
1,067
Sq Ft
$393/Sq Ft
Est. Value
About This Home
This home is located at 771C Saint Anns Ave Unit 43C, Bronx, NY 10456 and is currently estimated at $418,840, approximately $392 per square foot. 771C Saint Anns Ave Unit 43C is a home located in Bronx County with nearby schools including X298 Academy of Public Relations, Hostos-Lincoln Academy of Science, and Middle School 223 Laboratory School of Finance and Technology.
Ownership History
Date
Name
Owned For
Owner Type
Purchase Details
Closed on
May 24, 2021
Sold by
Almendarez Reina Isabel
Bought by
Almendarez Reina Isabel and Portillo Luis G
Current Estimated Value
Home Financials for this Owner
Home Financials are based on the most recent Mortgage that was taken out on this home.
Original Mortgage
$125,000
Outstanding Balance
$112,925
Interest Rate
2.9%
Mortgage Type
Purchase Money Mortgage
Estimated Equity
$305,915
Create a Home Valuation Report for This Property
The Home Valuation Report is an in-depth analysis detailing your home's value as well as a comparison with similar homes in the area
Home Values in the Area
Average Home Value in this Area
Purchase History
| Date | Buyer | Sale Price | Title Company |
|---|---|---|---|
| Almendarez Reina Isabel | -- | -- | |
| Almendarez Reina Isabel | -- | -- |
Source: Public Records
Mortgage History
| Date | Status | Borrower | Loan Amount |
|---|---|---|---|
| Open | Almendarez Reina Isabel | $125,000 | |
| Closed | Almendarez Reina Isabel | $125,000 |
Source: Public Records
Tax History Compared to Growth
Tax History
| Year | Tax Paid | Tax Assessment Tax Assessment Total Assessment is a certain percentage of the fair market value that is determined by local assessors to be the total taxable value of land and additions on the property. | Land | Improvement |
|---|---|---|---|---|
| 2025 | $1,547 | $7,702 | $197 | $7,505 |
| 2024 | $1,547 | $7,700 | $234 | $7,466 |
| 2023 | $1,523 | $7,500 | $264 | $7,236 |
| 2022 | $1,413 | $18,341 | $695 | $17,646 |
| 2021 | $0 | $15,411 | $695 | $14,716 |
| 2020 | $1,359 | $14,533 | $695 | $13,838 |
| 2019 | $1,050 | $14,187 | $695 | $13,492 |
| 2018 | $1,041 | $6,250 | $323 | $5,927 |
| 2017 | $765 | $5,897 | $331 | $5,566 |
| 2016 | $108 | $5,564 | $346 | $5,218 |
| 2015 | $74 | $5,348 | $449 | $4,899 |
| 2014 | $74 | $5,348 | $539 | $4,809 |
Source: Public Records
Map
Nearby Homes
- 745 St Anns Ave Unit C
- 769 Saint Ann's Ave Unit B
- 773 Saint Anns Ave Unit 44B
- 514 E 159th St Unit A
- 758 Brook Ave Unit 56C
- 782 Brook Ave Unit C
- 800 Brook Ave Unit 13B
- 808 Brook Ave Unit 9B
- 3044 3rd Ave Unit 4E
- 3044 3rd Ave Unit 6F
- 782 Cauldwell Ave
- 690 Saint Anns Ave
- 653 E 158th St
- 837 Washington Ave Unit 3J
- 837 Washington Ave Unit 3A
- 837 Washington Ave Unit 4B
- 837 Washington Ave Unit 7K
- 837 Washington Ave Unit 2G
- 837 Washington Ave Unit 7C
- 793 Jackson Ave
- 771D Saint Anns Ave Unit 43D
- 771B Saint Anns Ave Unit 43B
- 771A Saint Anns Ave Unit 43A
- 771 Saint Anns Ave Unit B
- 769 Saint Ann's Ave Unit 42B
- 773 Saint Anns Ave Unit C
- 773 St Anns Ave Unit 44D
- 773 St Anns Ave Unit 44D
- 773C Saint Anns Ave Unit 44C
- 773B Saint Anns Ave Unit 44B
- 777C Saint Anns Ave Unit 46C
- 777A Saint Anns Ave Unit 46A
- 775 St Anns Ave Unit 45D
- 775 St Anns Ave Unit 45A
- 775A Saint Ann's Ave Unit 45A
- 767D Saint Anns Ave Unit 41D
- 767C Saint Anns Ave Unit 41C
- 767A Saint Anns Ave Unit 41A
- 765 Saint Ann's Ave Unit 40A
- 765D Saint Anns Ave Unit 40D