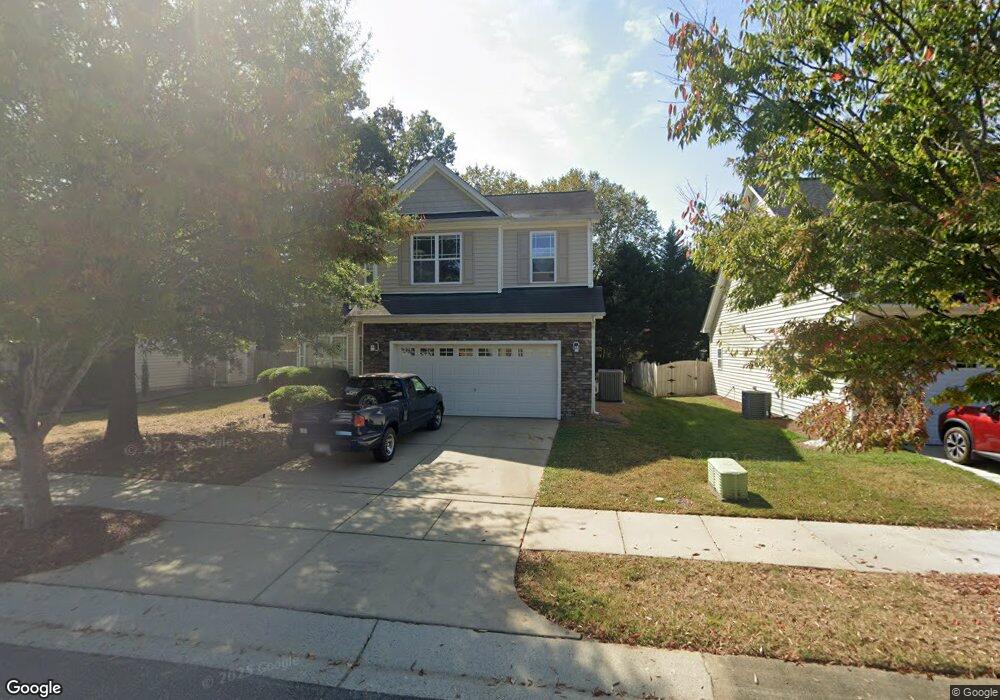
772 Cabin Branch Dr Fuquay Varina, NC 27526
Estimated Value: $438,000 - $475,000
3
Beds
4
Baths
2,349
Sq Ft
$192/Sq Ft
Est. Value
About This Home
This home is located at 772 Cabin Branch Dr, Fuquay Varina, NC 27526 and is currently estimated at $450,756, approximately $191 per square foot. 772 Cabin Branch Dr is a home located in Wake County with nearby schools including Fuquay-Varina High, Southern Wake Academy, and New School Montessori Center.
Ownership History
Date
Name
Owned For
Owner Type
Purchase Details
Closed on
Jun 29, 2022
Sold by
Jagielski Craig A
Bought by
Jagielski Craig A
Current Estimated Value
Home Financials for this Owner
Home Financials are based on the most recent Mortgage that was taken out on this home.
Original Mortgage
$326,961
Outstanding Balance
$311,066
Interest Rate
5.09%
Mortgage Type
VA
Estimated Equity
$139,690
Purchase Details
Closed on
Aug 22, 2017
Sold by
Almazan Ignacio X and Almazan Amanda M
Bought by
Jagielski Craig
Home Financials for this Owner
Home Financials are based on the most recent Mortgage that was taken out on this home.
Original Mortgage
$261,504
Interest Rate
4.03%
Mortgage Type
VA
Purchase Details
Closed on
May 28, 2009
Sold by
Bill Clark Homes Of Raleigh Llc
Bought by
Almazan Ignacio X and Almazan Amanda M
Home Financials for this Owner
Home Financials are based on the most recent Mortgage that was taken out on this home.
Original Mortgage
$183,262
Interest Rate
4.77%
Mortgage Type
VA
Create a Home Valuation Report for This Property
The Home Valuation Report is an in-depth analysis detailing your home's value as well as a comparison with similar homes in the area
Home Values in the Area
Average Home Value in this Area
Purchase History
| Date | Buyer | Sale Price | Title Company |
|---|---|---|---|
| Jagielski Craig A | -- | Rosenberg Jay A | |
| Jagielski Craig A | -- | None Listed On Document | |
| Jagielski Craig | $256,000 | None Available | |
| Almazan Ignacio X | $203,000 | None Available |
Source: Public Records
Mortgage History
| Date | Status | Borrower | Loan Amount |
|---|---|---|---|
| Open | Jagielski Craig A | $326,961 | |
| Closed | Jagielski Craig A | $326,961 | |
| Previous Owner | Jagielski Craig | $261,504 | |
| Previous Owner | Almazan Ignacio X | $183,262 |
Source: Public Records
Tax History Compared to Growth
Tax History
| Year | Tax Paid | Tax Assessment Tax Assessment Total Assessment is a certain percentage of the fair market value that is determined by local assessors to be the total taxable value of land and additions on the property. | Land | Improvement |
|---|---|---|---|---|
| 2025 | $3,898 | $443,145 | $90,000 | $353,145 |
| 2024 | $3,882 | $443,145 | $90,000 | $353,145 |
| 2023 | $3,116 | $278,450 | $42,000 | $236,450 |
| 2022 | $2,928 | $278,450 | $42,000 | $236,450 |
| 2021 | $2,791 | $278,450 | $42,000 | $236,450 |
| 2020 | $2,791 | $278,450 | $42,000 | $236,450 |
| 2019 | $2,673 | $230,054 | $42,000 | $188,054 |
| 2018 | $2,520 | $230,054 | $42,000 | $188,054 |
| 2017 | $2,430 | $230,054 | $42,000 | $188,054 |
| 2016 | $2,396 | $230,054 | $42,000 | $188,054 |
| 2015 | $2,310 | $229,100 | $40,000 | $189,100 |
| 2014 | -- | $229,100 | $40,000 | $189,100 |
Source: Public Records
Map
Nearby Homes
- 2108 Woodwater Dr
- 2117 Crockett Ridge Rd
- 929 Lukestone Dr
- 820 E Cardinal Dr
- 0 E Cardinal Dr
- 1053 Lukestone Dr
- 1056 Lukestone Dr
- 729 Culmore Dr
- 290 Marley Way
- 701 Occoneechee Dr
- 2323 Gathering Square Ct
- 2321 Gathering Square Ct
- 2305 Gathering Square Ct
- 2327 Gathering Square Ct
- 2205 Gathering Square Ct
- 2225 Gathering Square Ct Unit 2225
- 2328 Gathering Square Ct
- 2303 Gathering Square Ct
- 2314 Gathering Square Ct
- 2300 Gathering Square Ct
- 768 Cabin Branch Dr
- 719 Varina Ln
- 715 Varina Ln
- 764 Cabin Branch Dr
- 800 Cabin Branch Dr
- 709 Varina Ln
- 723 Varina Ln
- 773 Cabin Branch Dr
- 760 Cabin Branch Dr
- 777 Cabin Branch Dr
- 804 Cabin Branch Dr
- 769 Cabin Branch Dr
- 727 Varina Ln
- 705 Varina Ln
- 765 Cabin Branch Dr
- 2022 Woodwater Dr
- 756 Cabin Branch Dr
- 756 Cabin Branch Dr Unit 54
- 808 Cabin Branch Dr
- 716 Varina Ln