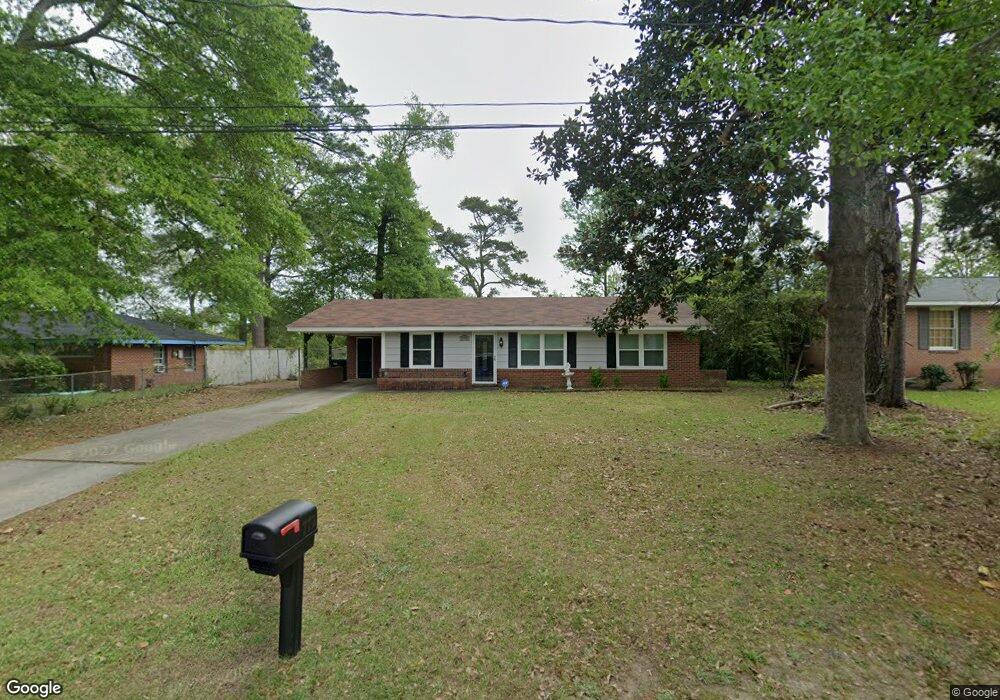
772 Cardinal Ave Columbus, GA 31907
Eastern Columbus NeighborhoodEstimated Value: $123,178 - $134,000
3
Beds
2
Baths
1,134
Sq Ft
$115/Sq Ft
Est. Value
About This Home
This home is located at 772 Cardinal Ave, Columbus, GA 31907 and is currently estimated at $130,045, approximately $114 per square foot. 772 Cardinal Ave is a home located in Muscogee County with nearby schools including Dimon Elementary School, Rothschild Leadership Academy, and Kendrick High School.
Ownership History
Date
Name
Owned For
Owner Type
Purchase Details
Closed on
Jun 12, 2020
Sold by
Cf Properties Llc
Bought by
Bryant Rodney
Current Estimated Value
Home Financials for this Owner
Home Financials are based on the most recent Mortgage that was taken out on this home.
Original Mortgage
$83,460
Outstanding Balance
$73,981
Interest Rate
3.2%
Mortgage Type
FHA
Estimated Equity
$56,064
Purchase Details
Closed on
Jun 19, 2019
Sold by
Carney Jalisha M
Bought by
Cf Properties Llc
Purchase Details
Closed on
Feb 25, 2015
Sold by
Cf Properties Llc
Bought by
Carney Jalisha M and Carney Christopher Jc
Home Financials for this Owner
Home Financials are based on the most recent Mortgage that was taken out on this home.
Original Mortgage
$54,900
Interest Rate
3.77%
Mortgage Type
New Conventional
Purchase Details
Closed on
Oct 31, 2014
Sold by
Fielder William A
Bought by
Cf Properties Llc
Create a Home Valuation Report for This Property
The Home Valuation Report is an in-depth analysis detailing your home's value as well as a comparison with similar homes in the area
Home Values in the Area
Average Home Value in this Area
Purchase History
| Date | Buyer | Sale Price | Title Company |
|---|---|---|---|
| Bryant Rodney | $85,000 | -- | |
| Cf Properties Llc | -- | -- | |
| Carney Jalisha M | $58,900 | -- | |
| Cf Properties Llc | $593,000 | -- |
Source: Public Records
Mortgage History
| Date | Status | Borrower | Loan Amount |
|---|---|---|---|
| Open | Bryant Rodney | $83,460 | |
| Previous Owner | Carney Jalisha M | $54,900 |
Source: Public Records
Tax History Compared to Growth
Tax History
| Year | Tax Paid | Tax Assessment Tax Assessment Total Assessment is a certain percentage of the fair market value that is determined by local assessors to be the total taxable value of land and additions on the property. | Land | Improvement |
|---|---|---|---|---|
| 2025 | $794 | $44,328 | $6,268 | $38,060 |
| 2024 | $793 | $44,328 | $6,268 | $38,060 |
| 2023 | $104 | $44,328 | $6,268 | $38,060 |
| 2022 | $827 | $34,756 | $6,268 | $28,488 |
| 2021 | $820 | $33,472 | $6,268 | $27,204 |
| 2020 | $959 | $23,480 | $6,268 | $17,212 |
| 2019 | $419 | $23,480 | $6,268 | $17,212 |
| 2018 | $419 | $23,600 | $6,268 | $17,332 |
| 2017 | $422 | $23,600 | $6,268 | $17,332 |
| 2016 | $424 | $23,560 | $5,120 | $18,440 |
| 2015 | $529 | $12,808 | $5,120 | $7,688 |
| 2014 | $1,087 | $26,285 | $5,120 | $21,165 |
| 2013 | -- | $26,285 | $5,120 | $21,165 |
Source: Public Records
Map
Nearby Homes
- 766 Cardinal Ave
- 4804 Bruning St
- 4903 Chapman St
- 644 Georgia Dr
- 815 Englewood Dr
- 754 Wright Dr
- 813 Wright Dr
- 702 Corley Dr
- 960 Lake Rushin Dr
- 533 Englewood Dr
- 4459 Bermuda St
- 822 Reaper Ln
- 4935 Buena Vista Rd
- 418 Henson Ave
- 809 Dogwood Dr
- 636 Dogwood Dr
- 391 & 401 Victoria Dr
- 410 McCartha Dr
- 5235 Vincent Dr
- 4414 Curry St
- 778 Cardinal Ave
- 760 Cardinal Ave
- 4805 Atterbury Dr
- 729 Georgia Dr
- 4470 Chapman St
- 4464 Chapman St
- 4802 Chapman St
- 4458 Chapman St
- 754 Cardinal Ave
- 4493 Childress St
- 723 Georgia Dr
- 4809 Atterbury Dr
- 4808 Chapman St
- 759 Cardinal Ave
- 4452 Chapman St
- 748 Cardinal Ave
- 755 Cardinal Ave
- 717 Georgia Dr
- 4487 Childress St
- 4814 Chapman St