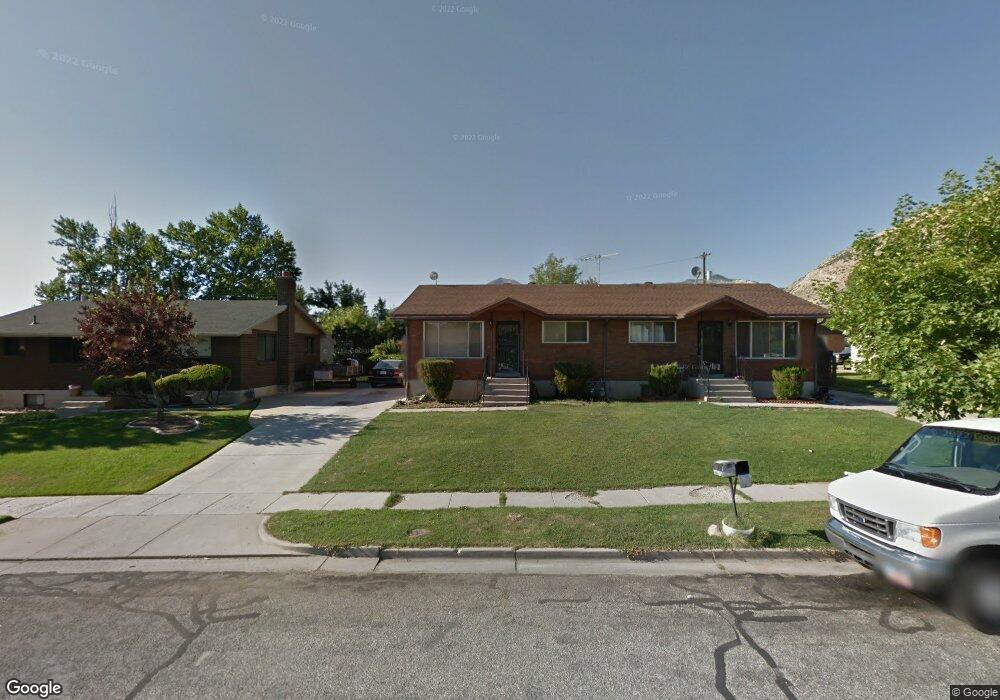
772 Cook St Ogden, UT 84404
Hillcrest-Bonneville NeighborhoodEstimated Value: $438,000 - $539,000
5
Beds
3
Baths
3,564
Sq Ft
$141/Sq Ft
Est. Value
About This Home
This home is located at 772 Cook St, Ogden, UT 84404 and is currently estimated at $503,034, approximately $141 per square foot. 772 Cook St is a home located in Weber County with nearby schools including Bonneville School, Highland Junior High School, and Ben Lomond High School.
Ownership History
Date
Name
Owned For
Owner Type
Purchase Details
Closed on
Jan 21, 2014
Sold by
Mark A And Janet Green Family Lp
Bought by
Gardner David S
Current Estimated Value
Purchase Details
Closed on
Apr 8, 2003
Sold by
Green Mark A and Green Janet
Bought by
Mark A & Janet Green Family Lp
Purchase Details
Closed on
Dec 27, 2002
Sold by
Calute Homes
Bought by
Green Mark and Green Janet
Home Financials for this Owner
Home Financials are based on the most recent Mortgage that was taken out on this home.
Original Mortgage
$134,900
Interest Rate
5.96%
Purchase Details
Closed on
Oct 18, 2000
Sold by
Calton Archie A and Calton Dorris M
Bought by
Calute Homes Inc
Home Financials for this Owner
Home Financials are based on the most recent Mortgage that was taken out on this home.
Original Mortgage
$142,637
Interest Rate
7.96%
Create a Home Valuation Report for This Property
The Home Valuation Report is an in-depth analysis detailing your home's value as well as a comparison with similar homes in the area
Home Values in the Area
Average Home Value in this Area
Purchase History
| Date | Buyer | Sale Price | Title Company |
|---|---|---|---|
| Gardner David S | -- | First American South Ogden | |
| Mark A & Janet Green Family Lp | -- | -- | |
| Green Mark | -- | Backman Stewart Title | |
| Calute Homes Inc | -- | First American Title |
Source: Public Records
Mortgage History
| Date | Status | Borrower | Loan Amount |
|---|---|---|---|
| Previous Owner | Green Mark | $134,900 | |
| Previous Owner | Calute Homes Inc | $142,637 |
Source: Public Records
Tax History
| Year | Tax Paid | Tax Assessment Tax Assessment Total Assessment is a certain percentage of the fair market value that is determined by local assessors to be the total taxable value of land and additions on the property. | Land | Improvement |
|---|---|---|---|---|
| 2025 | $3,605 | $528,490 | $100,000 | $428,490 |
| 2024 | $3,571 | $514,000 | $100,000 | $414,000 |
| 2023 | $3,244 | $470,000 | $74,000 | $396,000 |
| 2022 | $3,270 | $475,000 | $50,000 | $425,000 |
| 2021 | $3,107 | $412,000 | $50,000 | $362,000 |
| 2020 | $2,612 | $320,000 | $44,999 | $275,001 |
| 2019 | $2,182 | $251,000 | $34,961 | $216,039 |
| 2018 | $2,056 | $235,000 | $31,059 | $203,941 |
| 2017 | $1,760 | $187,910 | $30,998 | $156,912 |
| 2016 | $1,638 | $94,511 | $16,500 | $78,011 |
| 2015 | $1,569 | $88,316 | $16,500 | $71,816 |
| 2014 | $1,529 | $84,547 | $16,500 | $68,047 |
Source: Public Records
Map
Nearby Homes
- 756 3rd St
- 758 3rd St
- 415 Jackson Ave
- 983 Rancho Blvd Unit 3
- 1005 Douglas St
- 541 Cook St
- 1029 Douglas St
- 1042 Douglas St
- 525 3rd St
- 598 Plum Creek Ln
- 788 North St
- 1055 Collins Blvd
- 615 S Plum Creek Ln E
- 580 Marco Ln
- 1108 5th St
- 370 N Liberty Cove Dr Unit 5
- 1636 Washington Blvd
- 1149 Dan St
- 322 Harrison Blvd
- 186 N Harrison Blvd Unit 1
Your Personal Tour Guide
Ask me questions while you tour the home.