Estimated Value: $807,000 - $913,430
6
Beds
3
Baths
4,594
Sq Ft
$184/Sq Ft
Est. Value
About This Home
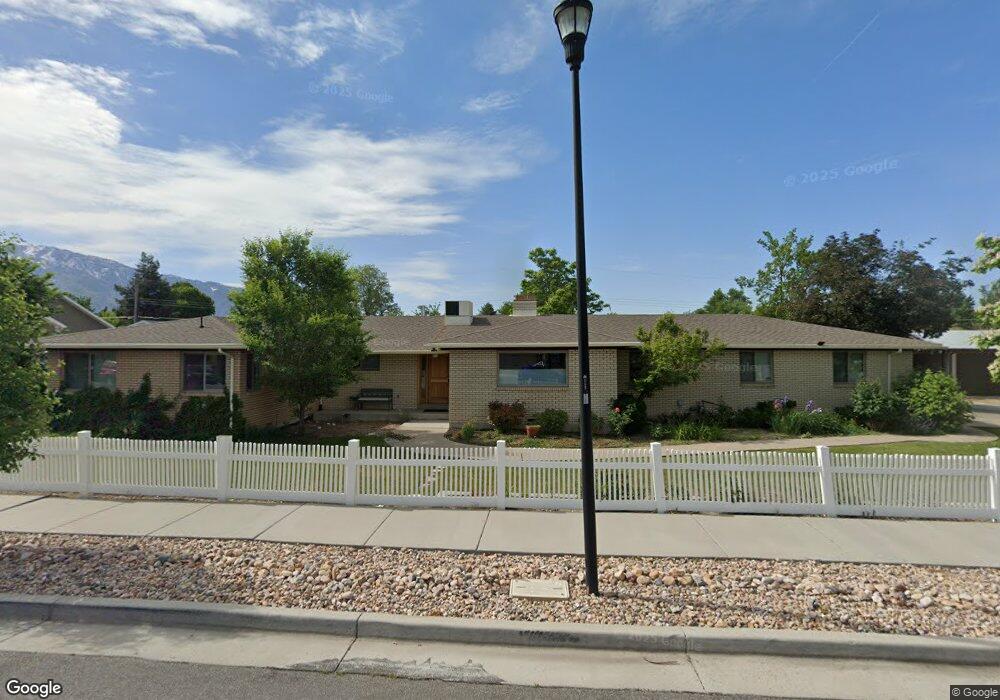
This home is located at 772 E Raintree Ave, Sandy, UT 84094 and is currently estimated at $846,108, approximately $184 per square foot. 772 E Raintree Ave is a home located in Salt Lake County with nearby schools including East Sandy School, Union Middle School, and Hillcrest High School.
Ownership History
Date
Name
Owned For
Owner Type
Purchase Details
Closed on
Jul 13, 2022
Sold by
Jason Jones
Bought by
Jason R Jones Living Trust
Current Estimated Value
Purchase Details
Closed on
Sep 5, 2020
Sold by
Jones Jason R
Bought by
Jones Jason
Home Financials for this Owner
Home Financials are based on the most recent Mortgage that was taken out on this home.
Original Mortgage
$460,000
Interest Rate
2.9%
Mortgage Type
New Conventional
Purchase Details
Closed on
Feb 5, 2018
Sold by
Thompson Wesley K and The Michelle Thompson Living T
Bought by
Jones Jason R
Home Financials for this Owner
Home Financials are based on the most recent Mortgage that was taken out on this home.
Original Mortgage
$475,000
Interest Rate
3.94%
Mortgage Type
New Conventional
Purchase Details
Closed on
Jul 10, 2017
Sold by
Thopmson Michaelle
Bought by
Thomapson Michelle and The Michelle Thompson Living Trust
Create a Home Valuation Report for This Property
The Home Valuation Report is an in-depth analysis detailing your home's value as well as a comparison with similar homes in the area
Home Values in the Area
Average Home Value in this Area
Purchase History
| Date | Buyer | Sale Price | Title Company |
|---|---|---|---|
| Jason R Jones Living Trust | -- | Vanguard Title | |
| Jones Jason | -- | Vanguard Title Union Park | |
| Jones Jason R | -- | First American Title | |
| Thomapson Michelle | -- | Accommodation |
Source: Public Records
Mortgage History
| Date | Status | Borrower | Loan Amount |
|---|---|---|---|
| Previous Owner | Jones Jason | $460,000 | |
| Previous Owner | Jones Jason R | $475,000 |
Source: Public Records
Tax History
| Year | Tax Paid | Tax Assessment Tax Assessment Total Assessment is a certain percentage of the fair market value that is determined by local assessors to be the total taxable value of land and additions on the property. | Land | Improvement |
|---|---|---|---|---|
| 2025 | $4,333 | $787,100 | $209,600 | $577,500 |
| 2024 | $4,333 | $800,300 | $201,600 | $598,700 |
| 2023 | $4,266 | $785,900 | $191,600 | $594,300 |
| 2022 | $4,353 | $784,200 | $187,800 | $596,400 |
| 2021 | $3,680 | $563,200 | $146,000 | $417,200 |
| 2020 | $3,522 | $508,600 | $146,000 | $362,600 |
| 2019 | $3,607 | $507,300 | $137,700 | $369,600 |
| 2016 | $2,639 | $357,100 | $137,700 | $219,400 |
Source: Public Records
Map
Nearby Homes
- 760 E 8080 S
- 8087 S 615 E
- 8268 S 865 E
- 798 E Spruce Tree Ln
- 7819 S Spruce Tree Ln
- 7899 S 930 E
- 8390 S 745 E
- 8322 S Levine Ln Unit 111
- 7692 Chad St
- 744 E 8425 S
- 954 E 7725 S
- 393 E Corral Creek Dr
- 600 E Briarsprings Cir
- 7956 S Farm House Ln
- 397 E Tractor Dr Unit 103
- 7640 S Quail Springs Cir
- 635 Pioneer Ave
- 991 Merewood Ct
- 7614 S 1000 E
- 8373 S 1100 E Unit 39
- 737 Raintree Ave
- 771 E 8080 S
- 779 E 8080 S
- 763 E 8080 S
- 784 E Raintree Ave
- 752 E Raintree Ave
- 759 Raintree Ave
- 771 E Raintree Ave
- 8023 S Pinewood Dr
- 785 E 8080 S
- 757 E 8080 S
- 779 E Raintree Ave
- 8034 S Pinewood Dr
- 793 E 8080 S
- 794 E Raintree Ave
- 8013 S Pinewood Dr
- 749 E 8080 S
- 787 E Raintree Ave
- 8026 S Pinewood Dr
- 801 E 8080 S
Your Personal Tour Guide
Ask me questions while you tour the home.