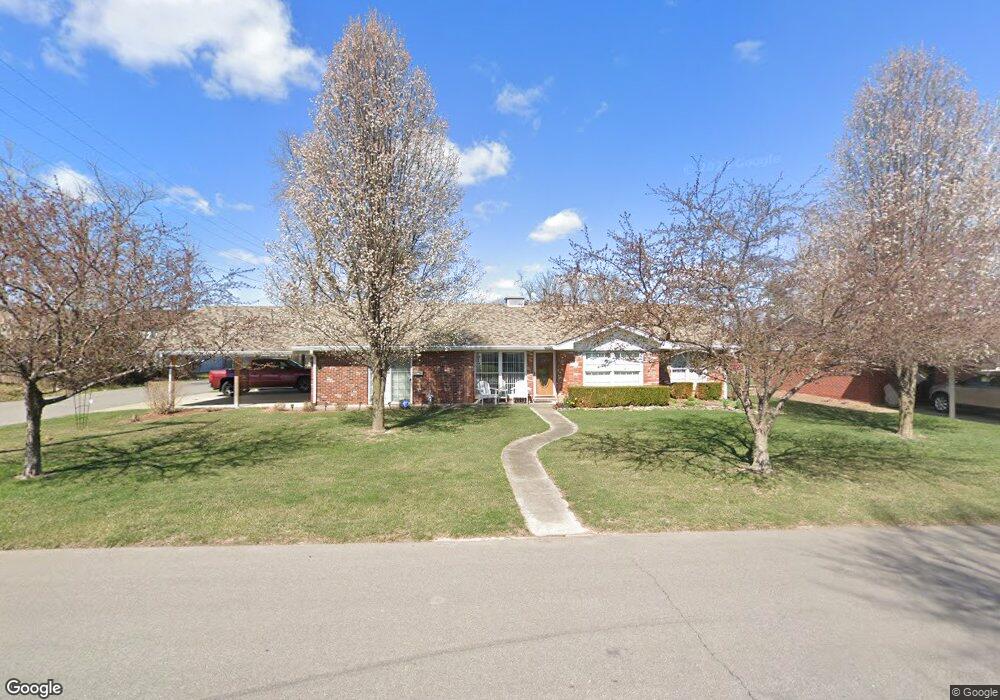
772 Lucas St Scottsburg, IN 47170
Estimated Value: $194,000 - $218,000
3
Beds
2
Baths
1,568
Sq Ft
$129/Sq Ft
Est. Value
About This Home
This home is located at 772 Lucas St, Scottsburg, IN 47170 and is currently estimated at $201,877, approximately $128 per square foot. 772 Lucas St is a home located in Scott County with nearby schools including Scottsburg Senior High School and Grace Christian Academy Inc.
Ownership History
Date
Name
Owned For
Owner Type
Purchase Details
Closed on
Jul 6, 2007
Sold by
Manshum Jamie R and Manshum Tabatha
Bought by
Royse Frankie J and Royse Irene
Current Estimated Value
Home Financials for this Owner
Home Financials are based on the most recent Mortgage that was taken out on this home.
Original Mortgage
$90,400
Outstanding Balance
$56,621
Interest Rate
6.54%
Mortgage Type
New Conventional
Estimated Equity
$145,256
Purchase Details
Closed on
Jun 21, 2007
Sold by
Manshum Jamie R and Manshum Tabatha
Bought by
Royse Frankie J and Royse Irene
Home Financials for this Owner
Home Financials are based on the most recent Mortgage that was taken out on this home.
Original Mortgage
$90,400
Outstanding Balance
$56,621
Interest Rate
6.54%
Mortgage Type
New Conventional
Estimated Equity
$145,256
Purchase Details
Closed on
Oct 10, 2000
Sold by
Railing Timothy C and Railing Williams C
Bought by
Railing Timothy C
Purchase Details
Closed on
Jul 24, 2000
Sold by
Reid James Q and Reid Patricia C
Bought by
Railing Timothy C and Railing Williams Dama C
Create a Home Valuation Report for This Property
The Home Valuation Report is an in-depth analysis detailing your home's value as well as a comparison with similar homes in the area
Home Values in the Area
Average Home Value in this Area
Purchase History
| Date | Buyer | Sale Price | Title Company |
|---|---|---|---|
| Royse Frankie J | -- | None Available | |
| Royse Frankie J | $113,000 | Wt&S Titls Llc | |
| Railing Timothy C | -- | -- | |
| Railing Timothy C | $95,500 | -- |
Source: Public Records
Mortgage History
| Date | Status | Borrower | Loan Amount |
|---|---|---|---|
| Open | Royse Frankie J | $90,400 |
Source: Public Records
Tax History Compared to Growth
Tax History
| Year | Tax Paid | Tax Assessment Tax Assessment Total Assessment is a certain percentage of the fair market value that is determined by local assessors to be the total taxable value of land and additions on the property. | Land | Improvement |
|---|---|---|---|---|
| 2024 | $551 | $142,400 | $12,800 | $129,600 |
| 2023 | $554 | $136,200 | $12,800 | $123,400 |
| 2022 | $464 | $129,800 | $12,900 | $116,900 |
| 2021 | $432 | $113,200 | $12,900 | $100,300 |
| 2020 | $433 | $116,600 | $12,900 | $103,700 |
| 2019 | $425 | $112,800 | $12,900 | $99,900 |
| 2018 | $470 | $111,700 | $12,900 | $98,800 |
| 2017 | $463 | $102,600 | $12,900 | $89,700 |
| 2016 | $452 | $95,500 | $12,900 | $82,600 |
| 2014 | $202 | $79,700 | $12,900 | $66,800 |
| 2013 | $202 | $86,100 | $12,800 | $73,300 |
Source: Public Records
Map
Nearby Homes
- 688 Wanda St
- 1114 N Pine St
- 615 Lakeshore Dr
- 779 N Washington St
- 951 York Rd
- 1239 Rolling Meadows Ct
- 476 N Meridian St
- 973 Wooded Trail
- 914 W Owen St
- 1231 Woodland Ave
- 82 Park Dr
- 25 N Beechwood Ave
- 431 N 3rd St
- 320 N 2nd St
- 633 W Cherry St
- 0 W State Rd 56 Unit 2025010768
- 1523 Omega Ct
- 322 N Nicole Ln
- 516 W Green St
- 43 S Railroad St