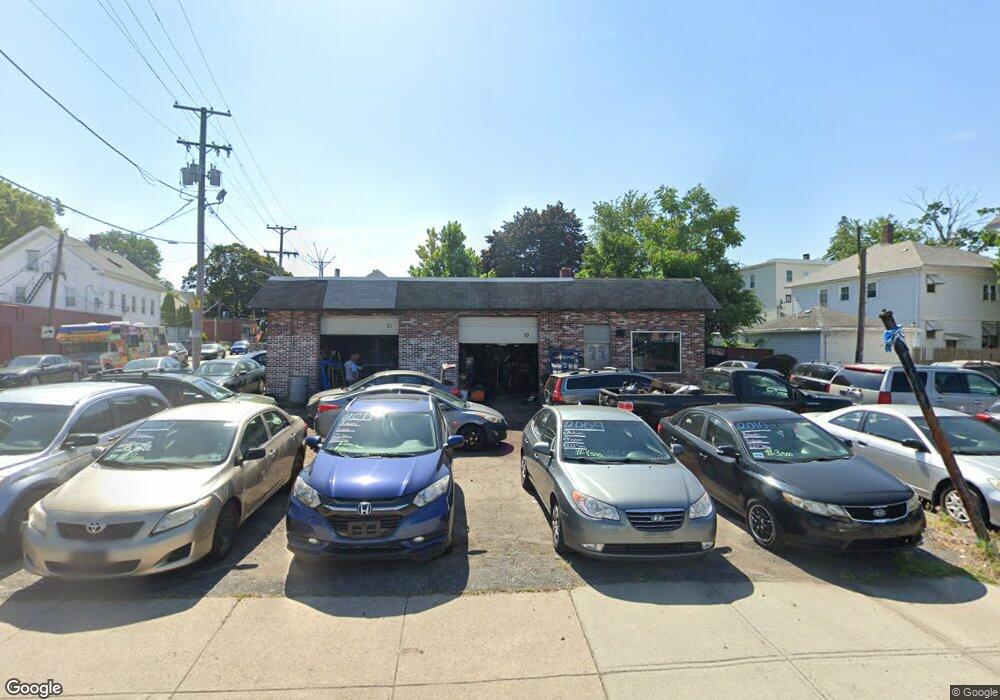
772 Main St Pawtucket, RI 02860
Woodlawn NeighborhoodEstimated Value: $220,841
Studio
--
Bath
1,355
Sq Ft
$163/Sq Ft
Est. Value
About This Home
This home is located at 772 Main St, Pawtucket, RI 02860 and is currently estimated at $220,841, approximately $162 per square foot. 772 Main St is a home located in Providence County with nearby schools including Trinity Academy for the Performing Arts, Dayspring Christian Academy, and Wheeler School.
Ownership History
Date
Name
Owned For
Owner Type
Purchase Details
Closed on
Jul 17, 2025
Sold by
Pawtucket City Of
Bought by
Airway Leasing Llc
Current Estimated Value
Purchase Details
Closed on
Dec 8, 2015
Sold by
Garcia Roberto and Pawtucket Town Of
Bought by
Garcia Roberto
Purchase Details
Closed on
Jul 24, 2009
Sold by
Goodman Tammy A
Bought by
Garcia Roberto
Home Financials for this Owner
Home Financials are based on the most recent Mortgage that was taken out on this home.
Original Mortgage
$40,000
Interest Rate
5.58%
Mortgage Type
Commercial
Create a Home Valuation Report for This Property
The Home Valuation Report is an in-depth analysis detailing your home's value as well as a comparison with similar homes in the area
Home Values in the Area
Average Home Value in this Area
Purchase History
| Date | Buyer | Sale Price | Title Company |
|---|---|---|---|
| Airway Leasing Llc | $5,285 | -- | |
| Airway Leasing Llc | $5,285 | -- | |
| Garcia Roberto | $4,439 | -- | |
| Garcia Roberto | $4,439 | -- | |
| Garcia Roberto | $92,700 | -- | |
| Garcia Roberto | $92,700 | -- |
Source: Public Records
Mortgage History
| Date | Status | Borrower | Loan Amount |
|---|---|---|---|
| Previous Owner | Garcia Roberto | $50,000 | |
| Previous Owner | Garcia Roberto | $40,000 |
Source: Public Records
Tax History
| Year | Tax Paid | Tax Assessment Tax Assessment Total Assessment is a certain percentage of the fair market value that is determined by local assessors to be the total taxable value of land and additions on the property. | Land | Improvement |
|---|---|---|---|---|
| 2025 | $4,061 | $176,500 | $90,300 | $86,200 |
| 2024 | $3,812 | $176,500 | $90,300 | $86,200 |
| 2023 | $4,193 | $141,400 | $75,100 | $66,300 |
| 2022 | $4,103 | $141,400 | $75,100 | $66,300 |
| 2021 | $4,103 | $141,400 | $75,100 | $66,300 |
| 2020 | $4,812 | $139,600 | $75,100 | $64,500 |
| 2019 | $4,812 | $139,600 | $75,100 | $64,500 |
| 2018 | $4,636 | $139,600 | $75,100 | $64,500 |
| 2017 | $4,552 | $130,500 | $79,000 | $51,500 |
| 2016 | $4,386 | $130,500 | $79,000 | $51,500 |
| 2015 | $4,386 | $130,500 | $79,000 | $51,500 |
| 2014 | $4,475 | $144,900 | $85,900 | $59,000 |
Source: Public Records
Map
Nearby Homes
Your Personal Tour Guide
Ask me questions while you tour the home.