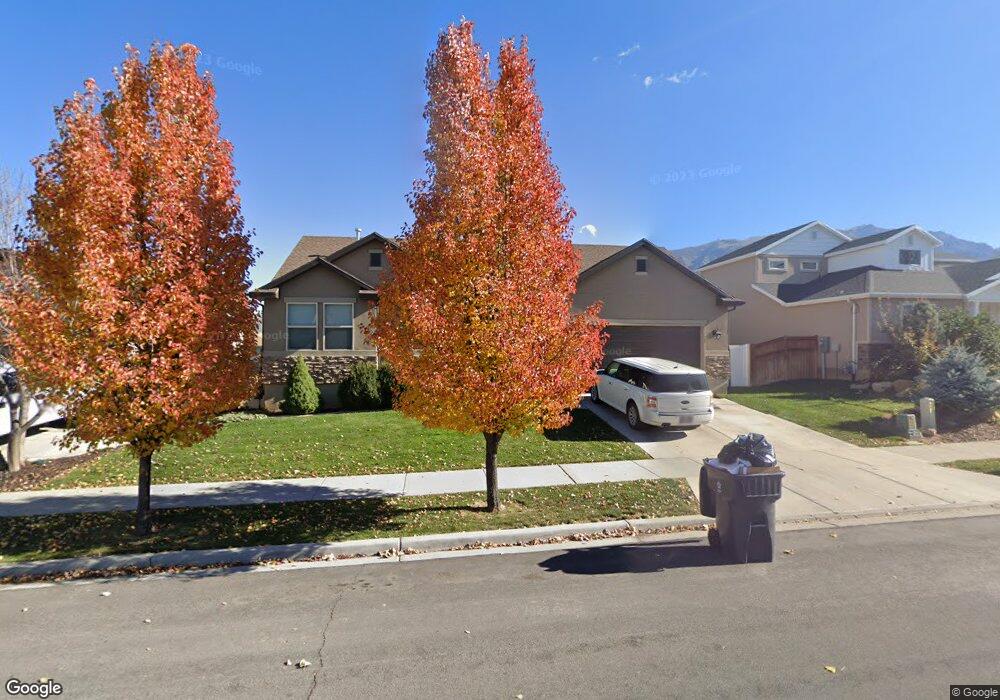
772 N 350 W Unit 2 Santaquin, UT 84655
Estimated Value: $498,769 - $540,000
2
Beds
2
Baths
2,200
Sq Ft
$235/Sq Ft
Est. Value
About This Home
This home is located at 772 N 350 W Unit 2, Santaquin, UT 84655 and is currently estimated at $517,442, approximately $235 per square foot. 772 N 350 W Unit 2 is a home located in Utah County with nearby schools including Apple Valley Elementary, Payson Junior High School, and Payson High School.
Ownership History
Date
Name
Owned For
Owner Type
Purchase Details
Closed on
May 17, 2012
Sold by
Edge Land 12 Llc
Bought by
Tijerina Tyson
Current Estimated Value
Home Financials for this Owner
Home Financials are based on the most recent Mortgage that was taken out on this home.
Original Mortgage
$185,062
Outstanding Balance
$148,244
Interest Rate
3.98%
Mortgage Type
USDA
Estimated Equity
$369,198
Purchase Details
Closed on
Jan 27, 2012
Sold by
Dp Santaquin Llc
Bought by
Edge Land 12 Llc
Create a Home Valuation Report for This Property
The Home Valuation Report is an in-depth analysis detailing your home's value as well as a comparison with similar homes in the area
Home Values in the Area
Average Home Value in this Area
Purchase History
| Date | Buyer | Sale Price | Title Company |
|---|---|---|---|
| Tijerina Tyson | -- | Affiliated First Title Co | |
| Edge Land 12 Llc | -- | First American American For |
Source: Public Records
Mortgage History
| Date | Status | Borrower | Loan Amount |
|---|---|---|---|
| Open | Tijerina Tyson | $185,062 |
Source: Public Records
Tax History Compared to Growth
Tax History
| Year | Tax Paid | Tax Assessment Tax Assessment Total Assessment is a certain percentage of the fair market value that is determined by local assessors to be the total taxable value of land and additions on the property. | Land | Improvement |
|---|---|---|---|---|
| 2025 | $2,289 | $264,935 | $131,400 | $350,300 |
| 2024 | $2,289 | $227,975 | $0 | $0 |
| 2023 | $2,352 | $234,960 | $0 | $0 |
| 2022 | $2,443 | $251,680 | $0 | $0 |
| 2021 | $2,126 | $339,600 | $74,100 | $265,500 |
| 2020 | $2,050 | $317,300 | $64,400 | $252,900 |
| 2019 | $1,881 | $297,800 | $64,400 | $233,400 |
| 2018 | $1,625 | $245,300 | $56,300 | $189,000 |
| 2017 | $1,554 | $125,290 | $0 | $0 |
| 2016 | $1,477 | $116,710 | $0 | $0 |
| 2015 | $1,391 | $107,800 | $0 | $0 |
| 2014 | $1,333 | $103,125 | $0 | $0 |
Source: Public Records
Map
Nearby Homes
- 162 W 690 N
- 358 W 910 N
- 951 N 215 W
- 949 N 215 W
- 947 N 215 W
- 953 N 215 W
- 931 N 215 W
- 41 W 770 N
- McIntosh Plan at The Orchards
- Honey Plan at The Orchards
- Cranford Plan at The Orchards
- Monroe Plan at The Orchards
- Benson Plan at The Orchards
- Gala Plan at The Orchards
- 109 W 930 N
- 894 N Apple Seed Ln
- 369 N 500 W Unit 3
- 600 N Center St
- 931 N 160 E Unit 11
- 921 N 160 E