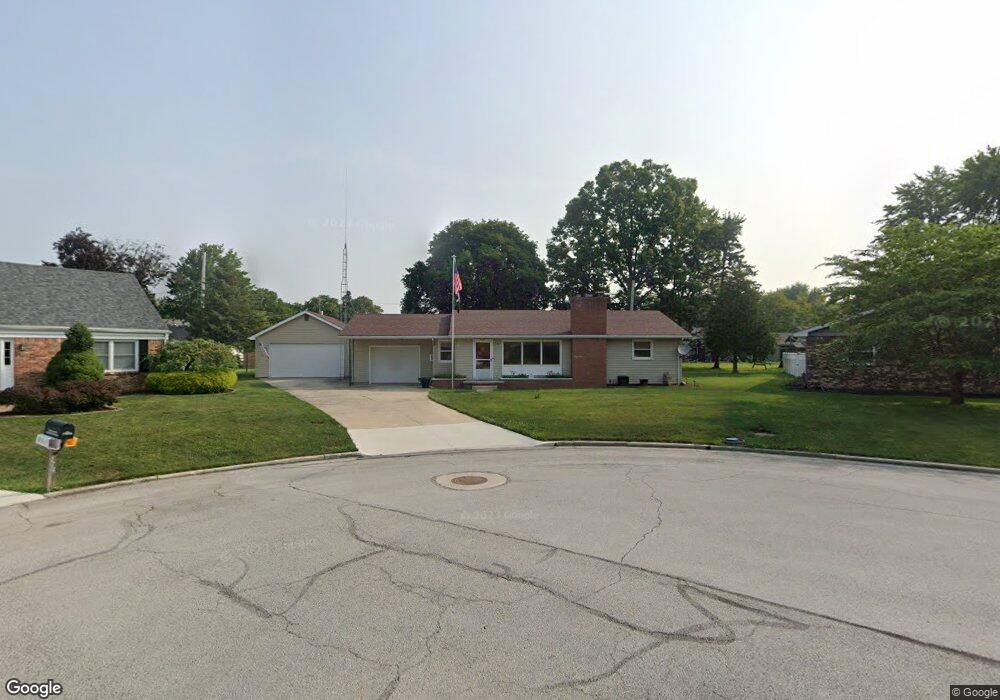
772 Riverside Dr Woodville, OH 43469
Estimated Value: $171,000 - $198,044
3
Beds
1
Bath
1,232
Sq Ft
$155/Sq Ft
Est. Value
About This Home
This home is located at 772 Riverside Dr, Woodville, OH 43469 and is currently estimated at $190,511, approximately $154 per square foot. 772 Riverside Dr is a home located in Sandusky County with nearby schools including Woodmore Elementary School, Woodmore Middle School, and Solomon Lutheran School.
Ownership History
Date
Name
Owned For
Owner Type
Purchase Details
Closed on
Feb 15, 2021
Sold by
Perkins Ann Renee and Perkins Robert Allen
Bought by
Johnson William J and Johnson Sue A
Current Estimated Value
Home Financials for this Owner
Home Financials are based on the most recent Mortgage that was taken out on this home.
Original Mortgage
$89,250
Outstanding Balance
$64,718
Interest Rate
2.65%
Mortgage Type
New Conventional
Estimated Equity
$125,793
Purchase Details
Closed on
Feb 2, 2021
Sold by
Grob Judith Ann and Grob Hans Paul
Bought by
Johnson William J and Johnson Sue A
Home Financials for this Owner
Home Financials are based on the most recent Mortgage that was taken out on this home.
Original Mortgage
$89,250
Outstanding Balance
$64,718
Interest Rate
2.65%
Mortgage Type
New Conventional
Estimated Equity
$125,793
Purchase Details
Closed on
Nov 1, 1990
Bought by
Grabenstetter Howard J and Grabenstetter Laurena A
Create a Home Valuation Report for This Property
The Home Valuation Report is an in-depth analysis detailing your home's value as well as a comparison with similar homes in the area
Home Values in the Area
Average Home Value in this Area
Purchase History
| Date | Buyer | Sale Price | Title Company |
|---|---|---|---|
| Johnson William J | $42,500 | Portage Valley Title | |
| Johnson William J | $42,500 | None Listed On Document | |
| Johnson William J | $42,500 | Portage Valley Title | |
| Grabenstetter Howard J | -- | -- |
Source: Public Records
Mortgage History
| Date | Status | Borrower | Loan Amount |
|---|---|---|---|
| Open | Johnson William J | $89,250 |
Source: Public Records
Tax History Compared to Growth
Tax History
| Year | Tax Paid | Tax Assessment Tax Assessment Total Assessment is a certain percentage of the fair market value that is determined by local assessors to be the total taxable value of land and additions on the property. | Land | Improvement |
|---|---|---|---|---|
| 2024 | $2,965 | $58,950 | $13,200 | $45,750 |
| 2023 | $2,965 | $43,650 | $9,770 | $33,880 |
| 2022 | $2,544 | $43,650 | $9,770 | $33,880 |
| 2021 | $2,617 | $43,650 | $9,770 | $33,880 |
| 2020 | $1,867 | $39,210 | $9,770 | $29,440 |
| 2019 | $1,868 | $39,210 | $9,770 | $29,440 |
| 2018 | $1,964 | $39,210 | $9,770 | $29,440 |
| 2017 | $1,708 | $35,810 | $9,770 | $26,040 |
| 2016 | $1,657 | $35,810 | $9,770 | $26,040 |
| 2015 | $1,657 | $35,810 | $9,770 | $26,040 |
| 2014 | $1,764 | $36,190 | $10,710 | $25,480 |
| 2013 | $1,745 | $36,190 | $10,710 | $25,480 |
Source: Public Records
Map
Nearby Homes
- 421 Parklane Dr
- 739 Riverside Dr
- 571 Parklane Dr
- 612 W Main St
- 219 Lime St
- 415 Fort Findlay Rd
- 212 S Perry St
- 110 E 1st St
- 712 Lueke Ave Unit 572 p
- 20180 Us Highway 23
- 20240 W Portage River South Rd
- 0 Recker Rd
- 2067 Devils Hole Rd
- 1936 County Road 32
- 0 Pemberville Rd
- 3291 Middleton Pike
- 510 Wilson St
- 19383 Courtland Ave
- 514 West St
- 416 Castle Cove
- 0 Riverside Dr
- 768 Riverside Dr
- 743 Erie St
- 774 Riverside Dr
- 747 Erie St
- 737 Erie St
- 764 Riverside Dr
- 749 Erie St
- 771 Riverside Dr
- 727 Erie St
- 315 Pemberville Rd
- 759 Riverside Dr
- 317 Pemberville Rd
- 624 Riverside Dr
- 744 Erie St
- 725 Erie St
- 189 Evergreen Dr
- 159 Evergreen Dr
- 736 Erie St
- 620 Riverside Dr