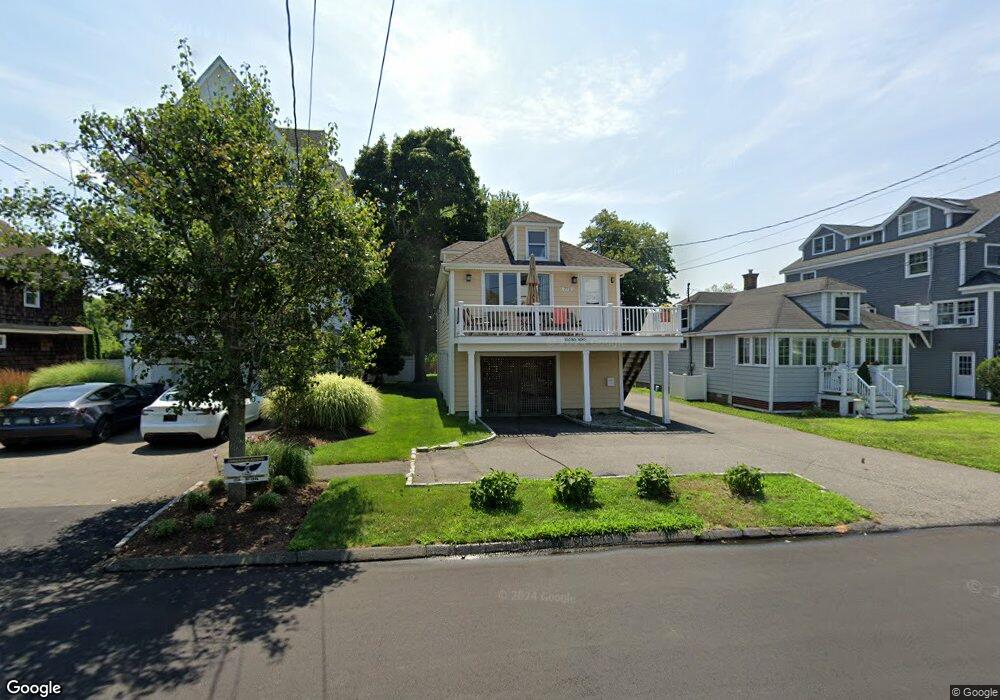
772 Rowland Rd Fairfield, CT 06824
Fairfield Beach NeighborhoodEstimated Value: $988,000 - $1,355,000
3
Beds
2
Baths
1,040
Sq Ft
$1,136/Sq Ft
Est. Value
About This Home
This home is located at 772 Rowland Rd, Fairfield, CT 06824 and is currently estimated at $1,181,577, approximately $1,136 per square foot. 772 Rowland Rd is a home located in Fairfield County with nearby schools including Roger Sherman Elementary School, Roger Ludlowe Middle School, and Fairfield Ludlowe High School.
Ownership History
Date
Name
Owned For
Owner Type
Purchase Details
Closed on
Jun 3, 2003
Sold by
Lighthouse Mgmt Llc
Bought by
Bilman Samuel Z and Bilman Helen
Current Estimated Value
Home Financials for this Owner
Home Financials are based on the most recent Mortgage that was taken out on this home.
Original Mortgage
$150,000
Interest Rate
5.86%
Purchase Details
Closed on
Mar 14, 1997
Sold by
Banks Andrew D and Barry Thomas A
Bought by
Lighthouse Mtmt Llc
Purchase Details
Closed on
Mar 13, 1997
Sold by
Brissette Andrew J and Curran John R
Bought by
Barry Thomas A and Banks Andrew D
Purchase Details
Closed on
Jun 18, 1992
Sold by
Dascenzo Victor and Dascenzo Christine
Bought by
Brissette Andrew J
Purchase Details
Closed on
Aug 10, 1988
Sold by
Chrysand Properties
Bought by
D'Ascenzo Victor
Create a Home Valuation Report for This Property
The Home Valuation Report is an in-depth analysis detailing your home's value as well as a comparison with similar homes in the area
Home Values in the Area
Average Home Value in this Area
Purchase History
| Date | Buyer | Sale Price | Title Company |
|---|---|---|---|
| Bilman Samuel Z | $123,750 | -- | |
| Bilman Samuel Z | $123,750 | -- | |
| Lighthouse Mtmt Llc | $188,000 | -- | |
| Lighthouse Mtmt Llc | $188,000 | -- | |
| Barry Thomas A | $188,000 | -- | |
| Barry Thomas A | $188,000 | -- | |
| Brissette Andrew J | $163,000 | -- | |
| D'Ascenzo Victor | $226,000 | -- |
Source: Public Records
Mortgage History
| Date | Status | Borrower | Loan Amount |
|---|---|---|---|
| Open | D'Ascenzo Victor | $320,000 | |
| Closed | D'Ascenzo Victor | $150,000 |
Source: Public Records
Tax History Compared to Growth
Tax History
| Year | Tax Paid | Tax Assessment Tax Assessment Total Assessment is a certain percentage of the fair market value that is determined by local assessors to be the total taxable value of land and additions on the property. | Land | Improvement |
|---|---|---|---|---|
| 2025 | $15,608 | $549,780 | $485,310 | $64,470 |
| 2024 | $15,339 | $549,780 | $485,310 | $64,470 |
| 2023 | $15,124 | $549,780 | $485,310 | $64,470 |
| 2022 | $14,976 | $549,780 | $485,310 | $64,470 |
| 2021 | $14,833 | $549,780 | $485,310 | $64,470 |
| 2020 | $11,554 | $431,270 | $365,120 | $66,150 |
| 2019 | $11,554 | $431,270 | $365,120 | $66,150 |
| 2018 | $11,368 | $431,270 | $365,120 | $66,150 |
| 2017 | $11,135 | $431,270 | $365,120 | $66,150 |
| 2016 | $10,976 | $431,270 | $365,120 | $66,150 |
| 2015 | $9,706 | $391,510 | $352,800 | $38,710 |
| 2014 | $9,129 | $374,150 | $352,800 | $21,350 |
Source: Public Records
Map
Nearby Homes
- 748 Rowland Rd
- 465 Edward St
- 6 Lighthouse Point
- 783 Reef Rd
- 1008 Fairfield Beach Rd
- 260 Birch Rd
- 394 Penfield Rd
- 35 Millard St
- 378 Penfield Rd
- 137 Millard St
- 1235 Fairfield Beach Rd
- 345 Reef Rd Unit B6
- 345 Reef Rd Unit C9
- 196 Catherine Terrace
- 294 Catherine Terrace
- 174 Sunnieholme Dr
- 2 Mellow St
- 96 Clinton St
- 127 Paul Place
- 117 Turney Rd
- 780 Rowland Rd
- 764 Rowland Rd
- 756 Rowland Rd
- 788 Rowland Rd
- 785 Rowland Rd
- 771 Rowland Rd
- 763 Rowland Rd
- 787 Rowland Rd
- 738 Rowland Rd
- 610 Fairfield Beach Rd
- 560 Fairfield Beach Rd
- 560 Fairfield Beach Rd Unit 2
- 560 Fairfield Beach Rd Unit B
- 560 Fairfield Beach Rd Unit A
- 799 Rowland Rd
- 753 Rowland Rd
- 734 Rowland Rd
- 743 Rowland Rd
- 730 Rowland Rd
- 587 Fairfield Beach Rd