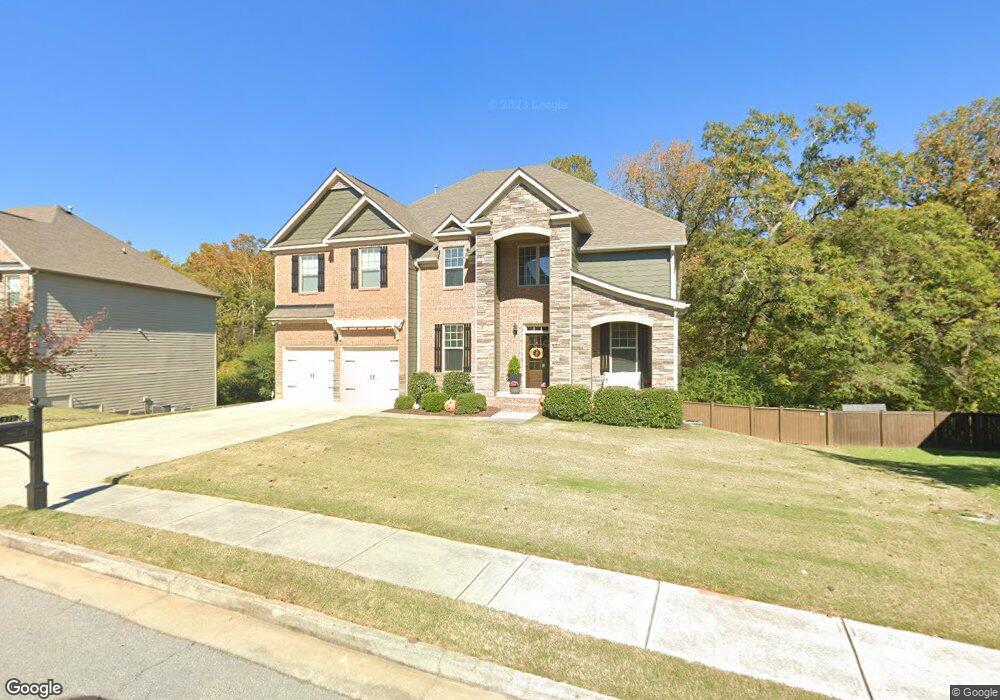
772 Sienna Valley Dr Braselton, GA 30517
Estimated Value: $578,480 - $862,000
--
Bed
--
Bath
4,141
Sq Ft
$161/Sq Ft
Est. Value
About This Home
This home is located at 772 Sienna Valley Dr, Braselton, GA 30517 and is currently estimated at $664,870, approximately $160 per square foot. 772 Sienna Valley Dr is a home with nearby schools including Bramlett Elementary School, Russell Middle School, and Winder-Barrow High School.
Ownership History
Date
Name
Owned For
Owner Type
Purchase Details
Closed on
Aug 28, 2015
Sold by
Century Communities Of Georgia Llc
Bought by
Fulcher Bryce C and Fulcher Rebecca L
Current Estimated Value
Home Financials for this Owner
Home Financials are based on the most recent Mortgage that was taken out on this home.
Original Mortgage
$320,456
Outstanding Balance
$252,638
Interest Rate
4.02%
Mortgage Type
Commercial
Estimated Equity
$412,232
Purchase Details
Closed on
Dec 30, 2014
Sold by
Reo Funding Solutions Iii Llc
Bought by
Century Communities Of Georgia Llc
Purchase Details
Closed on
May 30, 2012
Sold by
Crm Central Properties Llc
Bought by
Reo Funding Solutions Iii Llc
Purchase Details
Closed on
Nov 1, 2011
Sold by
Liberty Church Road Llc
Bought by
Crm Central Properties Llc
Purchase Details
Closed on
Dec 17, 2004
Sold by
Patronis Properties Inc
Bought by
Liberty Church Road Llc
Create a Home Valuation Report for This Property
The Home Valuation Report is an in-depth analysis detailing your home's value as well as a comparison with similar homes in the area
Home Values in the Area
Average Home Value in this Area
Purchase History
| Date | Buyer | Sale Price | Title Company |
|---|---|---|---|
| Fulcher Bryce C | $337,322 | -- | |
| Century Communities Of Georgia Llc | $43,300 | -- | |
| Reo Funding Solutions Iii Llc | $6,600 | -- | |
| Crm Central Properties Llc | $13,000 | -- | |
| Liberty Church Road Llc | $4,800,000 | -- |
Source: Public Records
Mortgage History
| Date | Status | Borrower | Loan Amount |
|---|---|---|---|
| Open | Fulcher Bryce C | $320,456 |
Source: Public Records
Tax History Compared to Growth
Tax History
| Year | Tax Paid | Tax Assessment Tax Assessment Total Assessment is a certain percentage of the fair market value that is determined by local assessors to be the total taxable value of land and additions on the property. | Land | Improvement |
|---|---|---|---|---|
| 2024 | $5,796 | $228,427 | $39,200 | $189,227 |
| 2023 | $5,337 | $228,427 | $39,200 | $189,227 |
| 2022 | $5,738 | $197,654 | $39,200 | $158,454 |
| 2021 | $4,721 | $152,843 | $26,000 | $126,843 |
| 2020 | $4,746 | $152,843 | $26,000 | $126,843 |
| 2019 | $4,817 | $152,843 | $26,000 | $126,843 |
| 2018 | $4,487 | $143,105 | $23,600 | $119,505 |
| 2017 | $3,797 | $130,405 | $23,600 | $106,805 |
| 2016 | $3,933 | $126,405 | $19,600 | $106,805 |
| 2015 | $381 | $11,760 | $11,760 | $0 |
| 2014 | $119 | $3,800 | $3,800 | $0 |
| 2013 | -- | $3,800 | $3,800 | $0 |
Source: Public Records
Map
Nearby Homes
- 793 Sienna Valley Dr
- 805 Sienna Valley Dr
- 2109 Yvette Way
- 747 Sienna Valley Dr
- 908 Rainsong Ct
- 914 Rainsong Ct
- 2046 Yvette Way
- 2017 Yvette Way
- 1560 Kaden Ln
- 47 Fonthill Cove
- 105 Chablis Ct
- 162 Valimar Dr
- 60 Bishop Creek
- 2162 Georgia Highway 211
- 1718 Landon Ln
- 345 Broadmoor Dr
- 1721 Landon Ln
- 13 Jocelyn Dr
- 195 King Village
- 2560 Olney Falls Dr
- 770 Sienna Valley Dr
- 774 Sienna Valley Dr
- 773 Sienna Valley Dr
- 768 Sienna Valley Dr
- 771 Sienna Valley Dr
- 776 Sienna Valley Dr
- 769 Sienna Valley Dr
- 777 Sienna Valley Dr
- 766 Sienna Valley Dr
- 783 Sienna Valley Dr
- 778 Sienna Valley Dr Unit 50
- 778 Sienna Valley Dr
- 767 Sienna Valley Dr
- 785 Sienna Valley Dr
- 785 Sienna Valley Dr Unit 95
- 787 Sienna Valley Dr
- 787 Sienna Valley Dr Unit 94
- 789 Sienna Valley Dr
- 952 Sienna Ridge